


FX.co ★ Actual patterns. Technical analysis and trading recommendations
Actual patterns

Bearish Rectangle
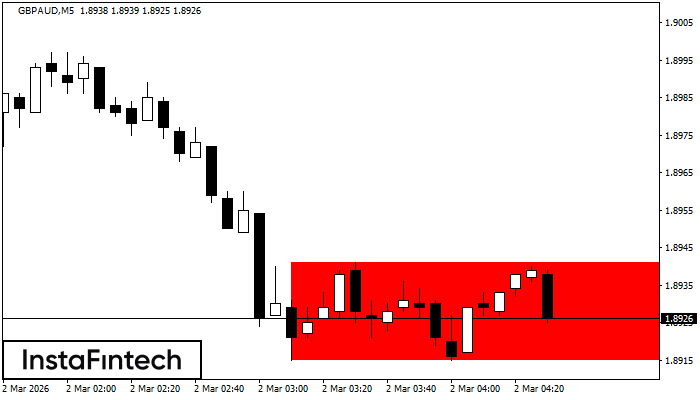
According to the chart of M5, GBPAUD formed the Bearish Rectangle. The pattern indicates a trend continuation. The upper border is 1.8941, the lower border is 1.8915. The signal means that a short position should be opened after fixing a price below the lower border 1.8915 of the Bearish Rectangle.
Double Bottom
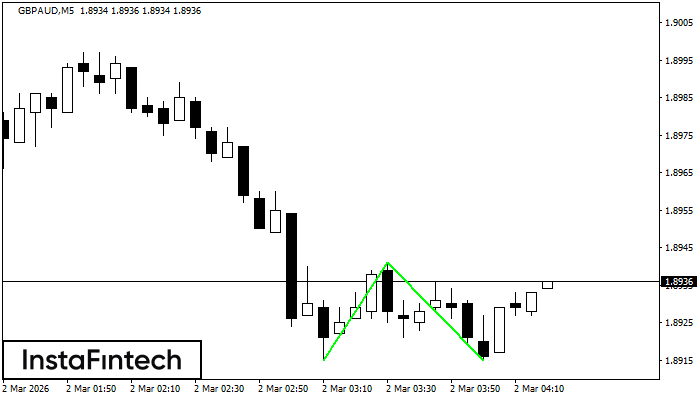
The Double Bottom pattern has been formed on GBPAUD M5. This formation signals a reversal of the trend from downwards to upwards. The signal is that a buy trade should be opened after the upper boundary of the pattern 1.8941 is broken. The further movements will rely on the width of the current pattern 26 points.
Double Bottom
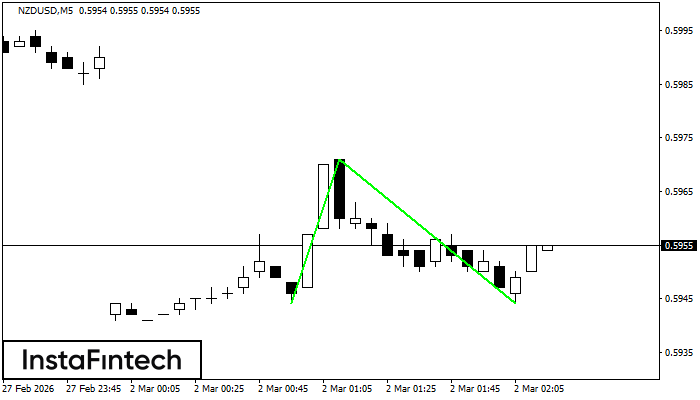
The Double Bottom pattern has been formed on NZDUSD M5. Characteristics: the support level 0.5944; the resistance level 0.5971; the width of the pattern 27 points. If the resistance level is broken, a change in the trend can be predicted with the first target point lying at the distance of 27 points.
Bearish pennant
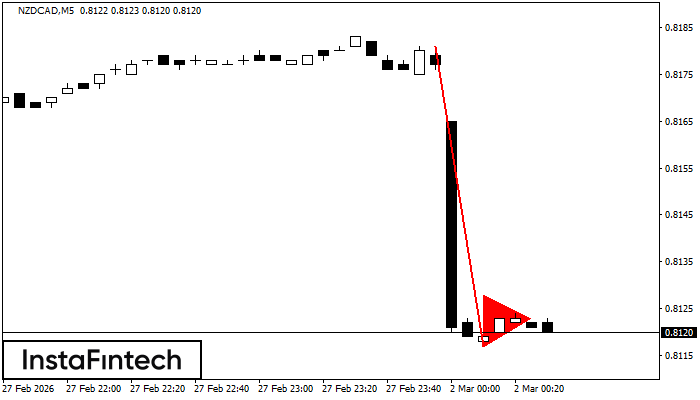
The Bearish pennant pattern has formed on the NZDCAD M5 chart. The pattern signals continuation of the downtrend in case the pennant’s low of 0.8117 is broken through. Recommendations: Place the sell stop pending order 10 pips below the pattern’s low. Place the take profit order at the projection distance of the flagpole height.
Inverse Head and Shoulder
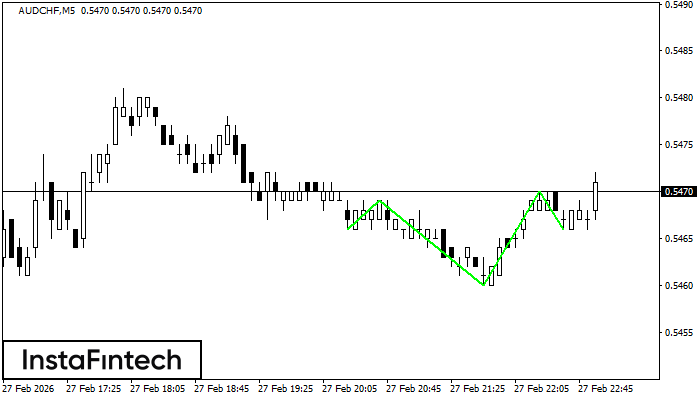
According to M5, AUDCHF is shaping the technical pattern – the Inverse Head and Shoulder. In case the Neckline 0.5469/0.5470 is broken out, the instrument is likely to move toward 0.5485.


