


FX.co ★ Modèles réels. Analyse technique et recommandations de trading
Modèles réels

Double Bottom
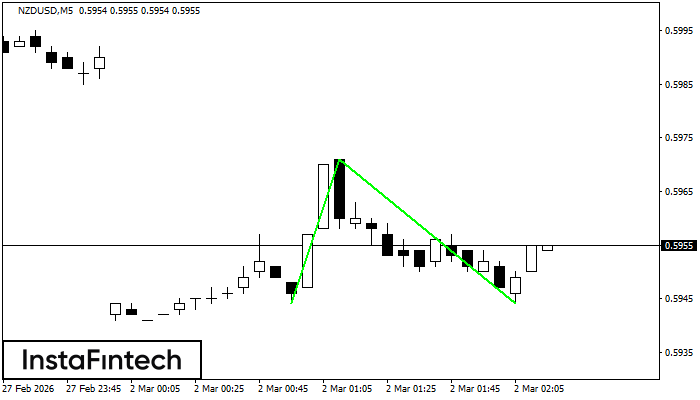
The Double Bottom pattern has been formed on NZDUSD M5. Characteristics: the support level 0.5944; the resistance level 0.5971; the width of the pattern 27 points. If the resistance level is broken, a change in the trend can be predicted with the first target point lying at the distance of 27 points.
Bearish pennant
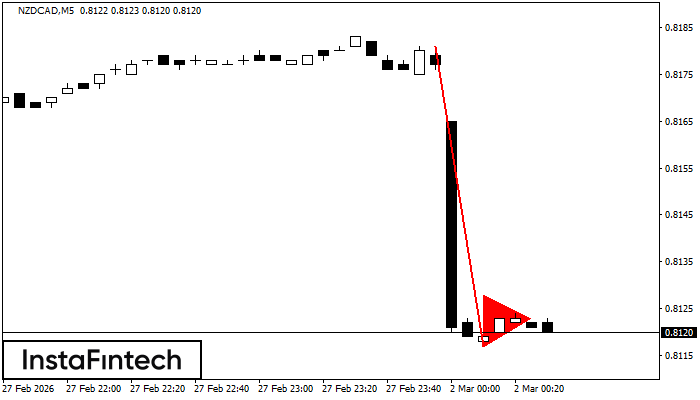
The Bearish pennant pattern has formed on the NZDCAD M5 chart. The pattern signals continuation of the downtrend in case the pennant’s low of 0.8117 is broken through. Recommendations: Place the sell stop pending order 10 pips below the pattern’s low. Place the take profit order at the projection distance of the flagpole height.
Inverse Head and Shoulder
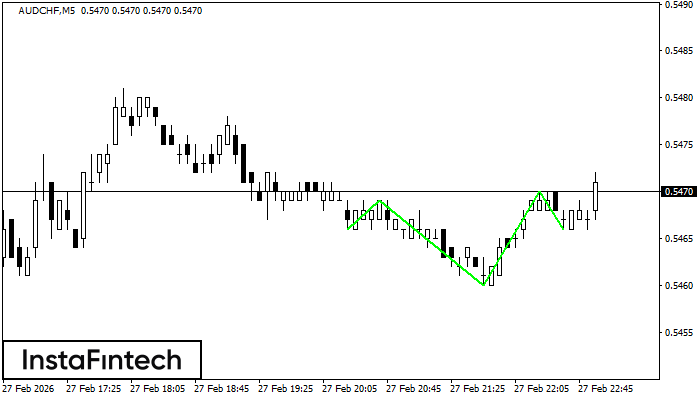
According to M5, AUDCHF is shaping the technical pattern – the Inverse Head and Shoulder. In case the Neckline 0.5469/0.5470 is broken out, the instrument is likely to move toward 0.5485.
Bearish Rectangle
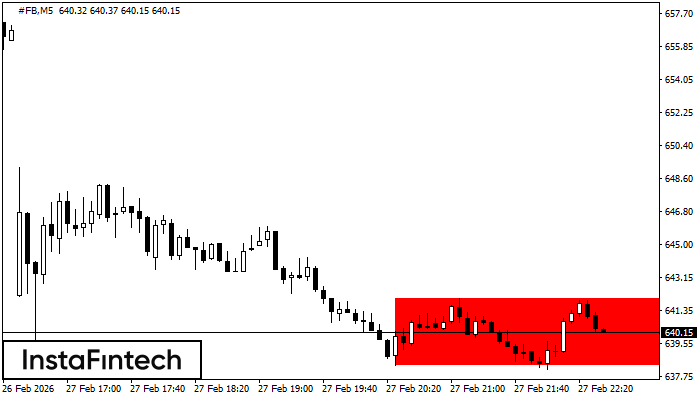
According to the chart of M5, #FB formed the Bearish Rectangle which is a pattern of a trend continuation. The pattern is contained within the following borders: lower border 638.36 – 638.36 and upper border 642.01 – 642.01. In case the lower border is broken, the instrument is likely to follow the downward trend.
Double Bottom
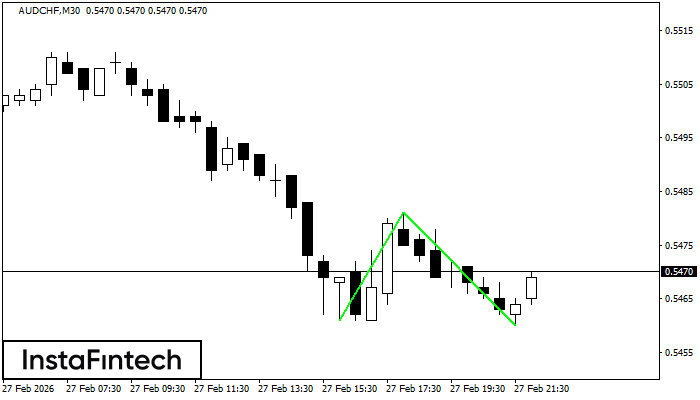
The Double Bottom pattern has been formed on AUDCHF M30. Characteristics: the support level 0.5461; the resistance level 0.5481; the width of the pattern 20 points. If the resistance level is broken, a change in the trend can be predicted with the first target point lying at the distance of 21 points.


