


There were many good entry signals yesterday. Let us look at the 5-minute chart and figure out what happened. In my morning review, I highlighted the level of 1.1820 and recommended making decisions with this level in mind. Bulls effortlessly broke above 1.1820 in the first half of the day. The resulting downward test of this range and the false breakout created a buy signal. As a result, GBP moved up by more than 70 pips. In the afternoon, GBP bulls performed a breakout and a downward retest of 1.1884, creating a new buy signal and extending the trend. Afterwards, GBP/USD jumped by more than 120 pips.
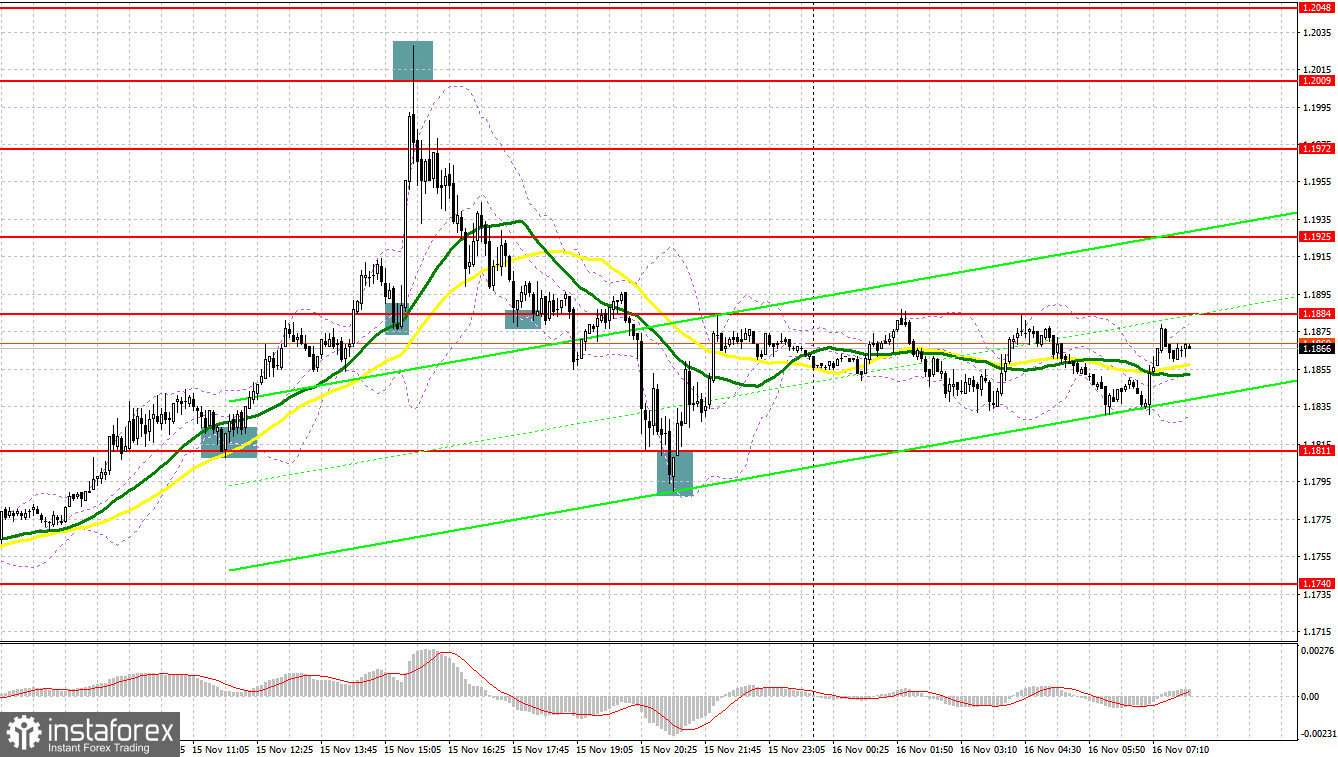
When to open long positions on GBP/USD:
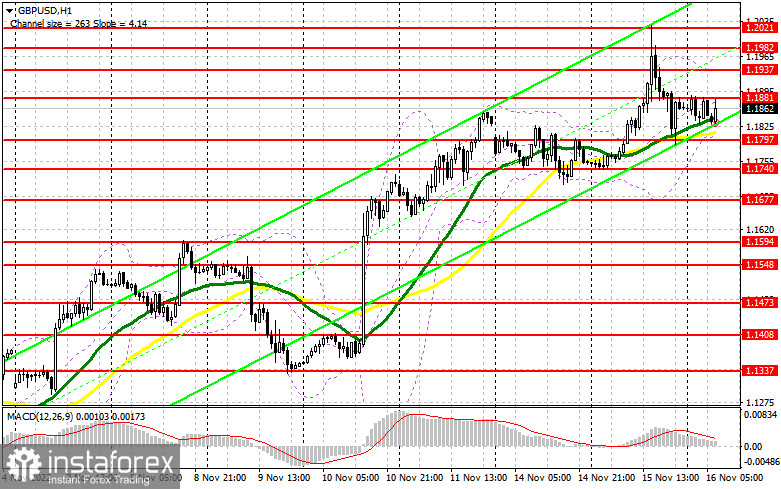
The pair's trajectory today will be determined by a number of key statistic data. Demand for risky assets is steadily decreasing amid yesterday's events in Poland which exacerbated the global geopolitical situation. Today's key data releases are the UK CPI and PPI reports. If inflation rises once again and exceeds forecasts, demand for the pound sterling will return, continuing the bull market. Higher inflation will force the Bank of England to continue aggressive interest rate hikes. In the afternoon, BoE governor Andrew Bailey will make a statement, followed by Bank of England monetary policy report hearings. These hearings will show the regulator's future policy, particularly in light of the latest inflation data. Therefore, the best option to open long positions is when the pair moves down near the closest support level of 1.1797, which was formed yesterday. A false breakout of this level will create a buy signal. Afterwards, GBP/USD may test the resistance level of 1.1881, which limits further growth. If the pair breaks above this level and performs a downward test, it may help bulls regain control. The pair's rise above 1.1881 could trigger a stronger uptrend and push the pair towards 1.1937 and 1.1982. A more distant target is 1.2021, where I recommend taking profit. If bulls fail to hold on to 1.1797, which may happen in the first half of the day, profit-taking will continue, putting additional pressure on the pair once again. In this situation, I recommend buying the pair only if it performs a false breakout of 1.1740. You can open long positions immediately if GBP/USD bounces off 1.1677 or 1.1594, keeping in mind an upward intraday correction of 30-35 pips.
When to open short positions on GBP/USD:
Bearish traders became more active following yesterday's reports of two missiles hitting Polish territory. The resulting large downward correction of risky assets balanced out the market. One important goal for bears today is preventing the pair from breaking above the resistance level of 1.1881, which was formed yesterday. A breakout above this level will extend the bullish trend. If GBP/USD performs a false breakout of 1.1881 on weak statistic data and concerns over faster-than-expected UK economic slowdown, it will be a good sell signal. Afterwards, GBP/USD may slide down to 1.1797. Moving averages right above this level will give support to the pair. If GBP/USD breaks through this level and performs an upwards test, it will create another sell signal, jeopardizing the situation for bullish traders. The pair's targets are 1.1740 and a more distant area of 1.1667, where I recommend taking profit. A test of this area will put an end to the bull run. If bears are idle in the 1.1881 area, bulls will continue to enter the market, pushing GBP/USD up to 1.1937. A false breakout of this level will create an entry point for opening short positions. However, if bears also show no activity there, you can sell GBP/USD immediately at a bounce from 1.1982, keeping in mind a downward intraday correction of 30-35 pips.
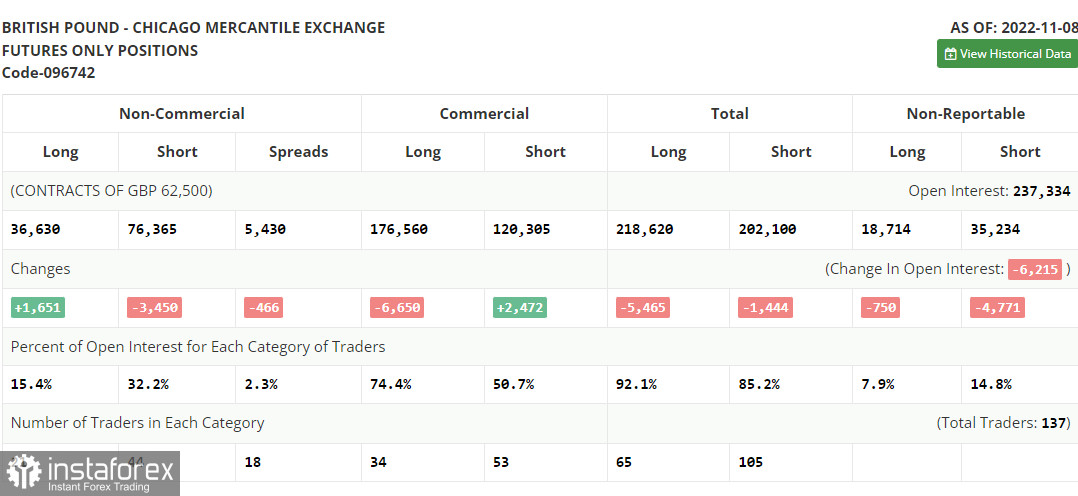
COT report:
The latest Commitment of Traders (COT) report from November 8 showed a decrease in the number of short positions, while long positions increased. The results of the Bank of England's policy meeting have affected the situation in the market. Demand for cheap GBP remains, even though the regulator does not plan to carry out aggressive monetary policy. The pound sterling found support in lower-than-expected US inflation data. However, it is unclear how long GBP will stay at its current highs. Problems in the UK economy, which were confirmed by the latest GDP data, continue to put pressure on the government and the Bank of England. The regulator's policy is slowing down the economy more and more. If the upcoming labor market data turn out to be negative, the pound sterling could drop sharply. According to the COT report, the number of long non-commercial positions increased by 1,651 to 36,630. Short non-commercial positions fell by 3,450 to 76,365. As a result, the net non-commercial position fell to -39,735 from -44,836 a week ago. The weekly closing price rose to 1.1549 from 1.1499.
Indicators' signals:
Moving averages
Trading is carried out above 30-day and 50-day moving averages, which indicates that the pound sterling may continue to rise.
Note: The period and prices of moving averages are considered by the author on the H1 (1-hour) chart and differ from the general definition of the classic daily moving averages on the daily D1 chart.
Bollinger Bands
If GBP/USD moves down, the indicator's lower border at 1.1797 will serve as support.
Description of indicators
Moving average (moving average, determines the current trend by smoothing out volatility and noise). Period 50. It is marked yellow on the chart. Moving average (moving average, determines the current trend by smoothing out volatility and noise). Period 30. It is marked green on the chart. MACD indicator (Moving Average Convergence/Divergence - convergence/divergence of moving averages) Quick EMA period 12. Slow EMA period to 26. SMA period 9 Bollinger Bands (Bollinger Bands). Period 20 Non-commercial speculative traders, such as individual traders, hedge funds, and large institutions that use the futures market for speculative purposes and meet certain requirements. Long non-commercial positions represent the total long open position of non-commercial traders. Short non-commercial positions represent the total short open position of non-commercial traders. Total non-commercial net position is the difference between the short and long positions of non-commercial traders.

