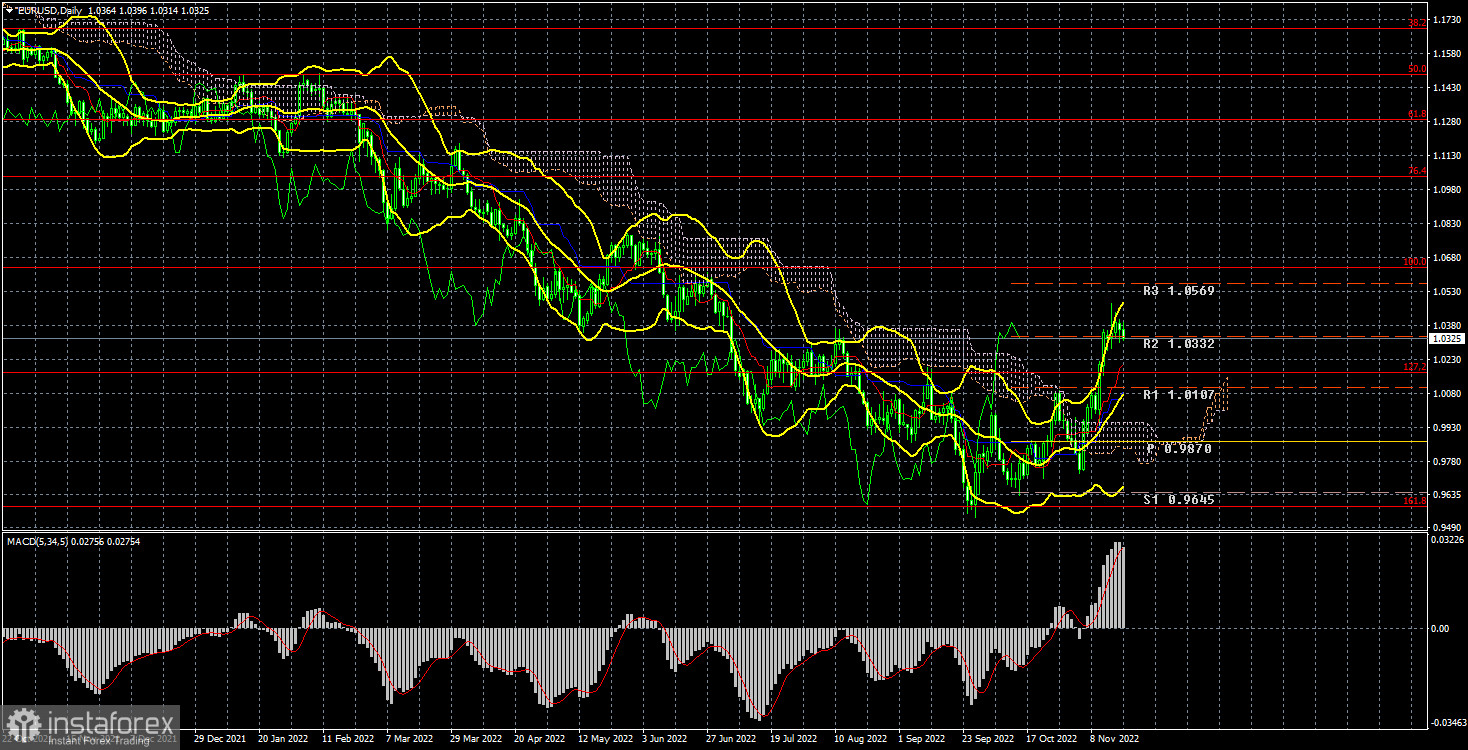
Long-term outlook.
The EUR/USD currency pair moved slowly during the current week, resulting in no significant price changes. We predicted a significant downward correction at the start of this week, but it has yet to materialize. Traders have been trying to decide whether to continue making speculative purchases of the euro currency or to return to a more stable dollar. The market was uninterested in the fundamental events that occurred. For example, the European Union's October inflation report was only the second assessment with which everyone was already familiar. As a result, the market did not react to the 10.6% y/y increase in inflation.
The US elections were incredibly fascinating, but it's fair to say that the outcomes were predictable. Republicans narrowly won the House of Representatives, while the Democrats kept control of the Senate with a majority. Given that they previously held control of both chambers of Congress, the Democrats' situation has worsened. In contrast, many American journalists and experts refer to this loss as "the defeat of the Republicans" because of the Republicans' confidence in the prospect of a decisive defeat. Many believed that Donald Trump, the party's leader, was laying the groundwork for the elections of 2024. He congratulated the Republicans on their victory and asserted that it was his merit before the vote count was finished. Trump then began his favorite record about "numerous violations at polling stations" after it became apparent that there would be no victory in the Senate and a slight advantage in the House of Representatives. In the end, he did submit a formal application to run in the 2024 presidential election.
Recall that the Democrats receive the most criticism from Americans regarding high inflation and the current economic downturn. Inflation can safely return to 2% over the following two years, and the recession can end without actually beginning. Therefore, we predict that Biden will win a second term in office rather than Trump winning another term as US president in 2024.
COT evaluation.
The predictions from the COT report for the euro in 2022 are paradoxical. They displayed the openly "bullish" attitude of professional traders for the first half of the year, but the value of the euro was steadily declining at the same time. Then they displayed a "bearish" attitude for a while, and the value of the euro also steadily declined. The euro has barely budged from its 20-year lows, and the net position of non-profit traders has turned bullish again and is strengthening. As we've already mentioned, this is taking place due to the continued high demand for the US dollar against a challenging geopolitical backdrop. As a result, although demand for the euro currency is rising, the strong demand for the dollar prevents the euro currency from experiencing significant growth. The number of buy-contracts from the "non-commercial" group increased by 7,000 during the reporting week, while the number of shorts decreased by 2,000. The net position consequently increased by roughly 5,000 contracts. Recent weeks have shown a gradual increase in the value of the euro, which already accords with the COT report's indications. However, the geopolitics are likely to remain the same, or there may not be enough reasons for the euro to continue to grow. The upward trend may end as the green and red lines of the first indicator are very far apart from one another. For non-commercial traders, there are 113 thousand more buy than sell contracts. As a result, although the net position of the "Non-commercial" group may continue to increase, the euro may not experience a similar increase. Sales are 39 thousand more if you look at the overall open long and short position indicators for all trading categories (635k vs. 596k).
Fundamental event analysis
This week, there were no significant macroeconomic reports. Last week, when the US inflation report had the effect of a bomb detonating in the market, traders were very active in buying the pair. However, we stated that while the reaction in the form of a fall in the dollar is quite logical, the strength of its fall raises concerns. The inflation report wasn't so significant or shocking that traders started selling off US currency in large quantities. Many people are still determining the best course of action when buying the euro currency, which appears to be in the early stages of developing a new upward trend. In contrast to the ECB, the Fed will keep raising interest rates. Furthermore, neither the timing nor the identity of the party whose final bid will be higher is known. Technical factors favor the euro, and the fundamental environment offers limited support for this currency.
Trading strategy for the week of November 21–25 :
1) The pair crossed all of the Ichimoku indicator's lines in the 24-hour time frame, giving it a real chance of long-term growth for the first time in a long time. Of course, if geopolitics deteriorates again, these opportunities could vanish quickly. However, we can confidently anticipate an upward movement with a target of 1.0636 (100.0% Fibonacci) and cautiously buy the pair.
2) The sales of the euro/dollar pair are no longer significant. You should now wait for the price to return below the important Ichimoku indicator lines before thinking about short positions.
Explanations of the illustrations:
Price levels of support and resistance (resistance and support), Fibonacci levels – target levels when opening purchases or sales. Take Profit levels can be placed near them.
Ichimoku indicators (standard settings), Bollinger Bands (standard settings), MACD (5, 34, 5).
The net position size of each trading category is represented by Indicator 1 on the COT charts.
The net position size for the "Non-commercial" group is indicated by indicator 2 on the COT charts.


