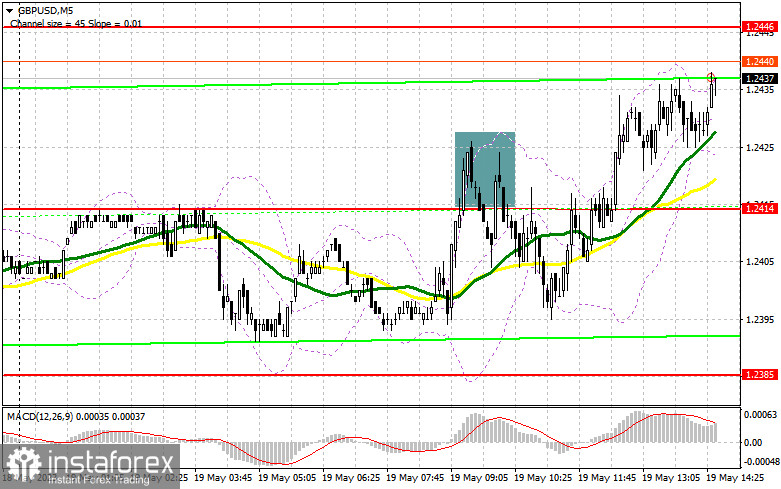
Previously I highlighted the level of 1.2414 and recommended making decisions with this level in mind. Let us take a look at the 5-minute chart and see what happened. There was an impressive sell signal following a false breakout, which was followed by a rise. However, at the end of the week, the investor's appetite for short positions was seemingly limited, which I predicted earlier. The pound dipped by 20 pips, however demand for GBP/USD rebounded, prompting a revision of the technical situation.

When to open long positions on GBP/USD:
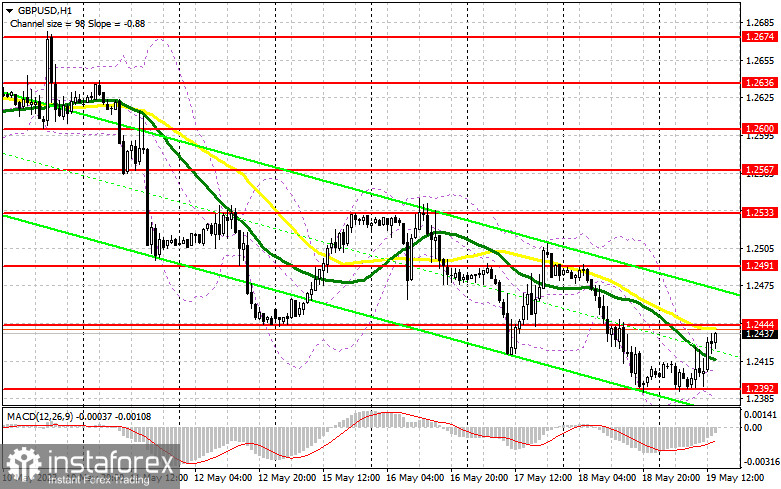
We're awaiting the market response to upcoming remarks by FOMC's John Williams and Michelle Bowman, as well as Fed Chair Jerome Powell. A slight GBP decline during these political interviews could lead to a false breakout around the monthly 1.2392 low. This could trigger a buy signal and boost the pair to approximately 1.2444, where bearish activity is likely to resurface. The moving averages in that area favor bears. A breakout and a downward retest of 1.2444 could create another buy signal and bolster bullish market presence, potentially propelling the pair towards 1.2491. The most distant target remains at 1.2533, where I will take profits.
If the pair falls to 1.2392 with no notable activity of bullish traders by the end of the day, I will open new long positions after the pair hits the monthly low of 1.2353 and performs a false breakout of that level. I will go long immediately on the rebound from the low at 1.2310, aiming for an intraday correction of 30-35 pips.
When to open short positions on GBP/USD:
Although bears made a push in the morning, they fell short of renewing monthly lows. Hence, an upward correction is currently underway. A compelling sell scenario would involve a false breakout of 1.2444 resistance level formed yesterday. Then, the support level of 1.2393 will become a target for bears. A breakout and an upward retest of that level could intensify the pressure on the pair and create a sell signal, pushing GBP/USD towards 1.2353. The most distant target is the low at 1.2310 low, where I plan to take profits.

In GBP/USD rises and bears are idle 1.2444, short positions should only be opened when the resistance level of 1.2491 is tested. Hawkish remarks from Fed representatives and a false breakout here could provide an entry point for short positions. If there is no downward movement here, one could sell the pair immediately on the rebound off 1.2533, targeting an intraday correction of 30-35 pips
Commitment of Traders report:
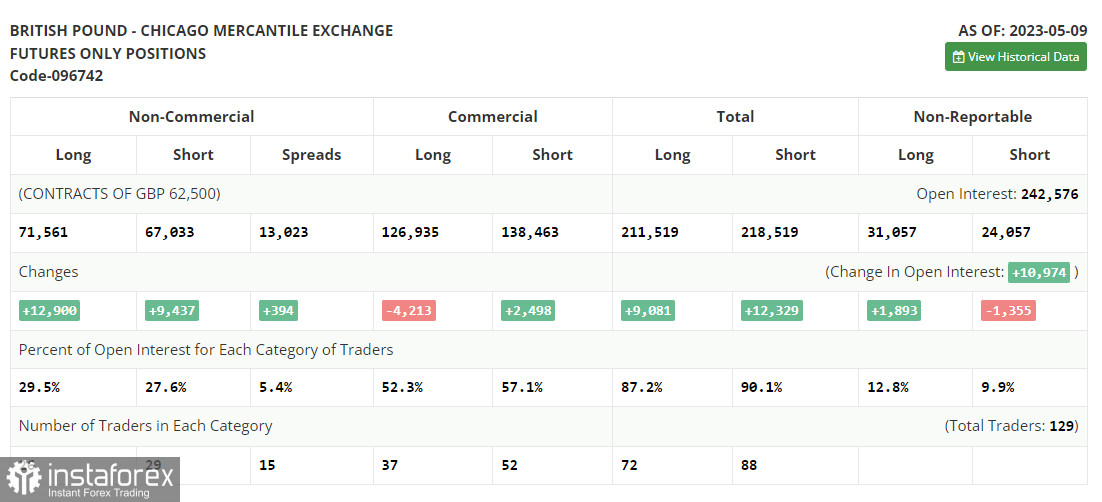
The latest Commitment of Traders (COT) report from May 9 shows an uptick in both short and long positions. Despite the Bank of England's interest rate hike not factored into this data, there's a prominent trend towards accumulating long positions, indicating that market participants are inclined to go long on the pound even at its current levels. This, coupled with the substantial correction at the end of the week, will likely bolster demand for the trading instrument demand. The report shows non-commercial short positions went up by 12,900 to 71,561, while long non-commercial positions spiked by 9,437 to 9,437. Consequently, the non-commercial net position climbed to 4,528, up from 1,065 the previous week. The pound is expected to benefit from this renewed growth. Furthermore, the weekly price advanced to 1.2635 from 1.2481.

Indicator signals
Moving averages:
Trading is currently carried out below the 30 and 50-day moving averages, which signals the potential for an extended downward trend.
Note: The period and prices of moving averages are considered by the author on the H1 (1-hour) chart and differ from the general definition of the classic daily moving averages on the daily D1 chart.
Bollinger Band:
Should GBP/USD decline further, the lower band of the indicator around 1.2390 is likely to provide support to the pair.
Description of indicators
Moving average (moving average, determines the current trend by smoothing out volatility and noise). Period 50. It is marked yellow on the chart. Moving average (moving average, determines the current trend by smoothing out volatility and noise). Period 30. It is marked green on the chart. MACD indicator (Moving Average Convergence/Divergence - convergence/divergence of moving averages) Quick EMA period 12. Slow EMA period to 26. SMA period 9 Bollinger Bands (Bollinger Bands). Period 20 Non-commercial speculative traders, such as individual traders, hedge funds, and large institutions that use the futures market for speculative purposes and meet certain requirements. Long non-commercial positions represent the total long open position of non-commercial traders. Short non-commercial positions represent the total short open position of non-commercial traders. Total non-commercial net position is the difference between the short and long positions of non-commercial traders.


