Long-term perspective.

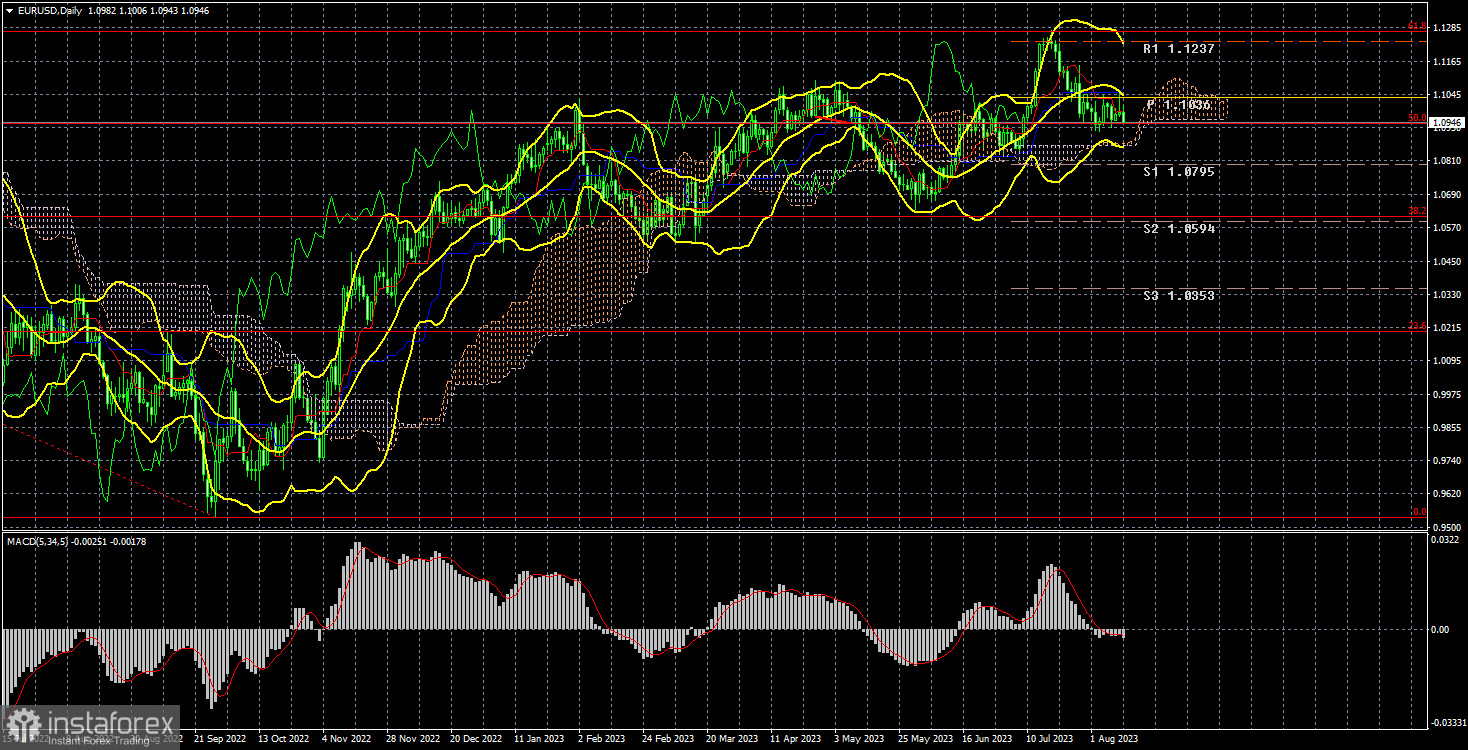
The EUR/USD currency pair stood still throughout the week. There needed to be macroeconomic data on Monday, Tuesday, Wednesday, and Friday. Only on Thursday was an important inflation report published in the US, which triggered significant market movements. However, overall, these movements did not affect the bigger picture. The pair is still adjusting, still positioned below the critical line, and can still drop to the Senkou Span B line, which lies at 1.0862. It still lacks the urge to move downward and can't surpass the 50.0% Fibonacci level.
Thus, the technical picture, as well as the fundamentals and macroeconomics, remained unchanged this week. We assert that US economic data is much better than in the EU, and the market has had ample time to factor in all the ECB rate hikes, even those that have yet to occur. If we consider the upward trend, which has been ongoing for 11 months, the upward movement has slowed in the last six months. So, there are indirect signs that the upward trend is ending, but it still doesn't want to conclude. However, we also don't see any reasons for further growth of the European currency.
Regarding the inflation report, it slightly increased the likelihood of a further tightening of US monetary policy in September. No matter how much inflation has risen in the US, it did rise, which is unlikely to please the Fed. There will also be an August report. If it doesn't show a decline in the consumer price index, then there's no doubt that the rate will rise in September. And this is a growth factor for the American currency.
COT Analysis

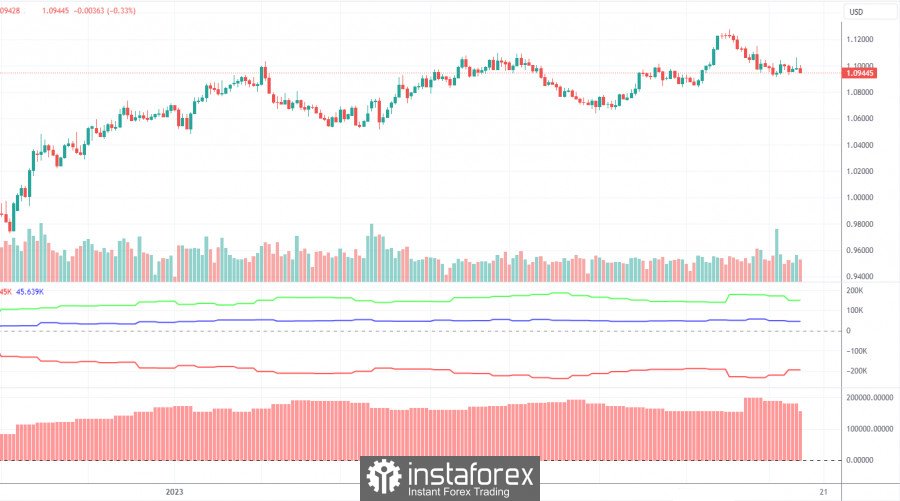
Last Friday, the latest COT report dated August 8th was published. Remarkably, for the past 11 months, the data from these reports has been in sync with market dynamics. The accompanying graphic distinctly shows that, beginning in September 2022, the net position of key market participants (as seen in the second indicator) commenced its ascent. Coincidentally, the European currency embarked on an upward trajectory around the same timeframe. While the net position has seen minimal growth in the recent 6-7 months, the Euro remains resilient, resisting a decline. Non-commercial traders maintain a robust "bullish" net position, and as a result, the European currency has been consistently gaining strength against the dollar from a longer-term perspective.
We've historically highlighted to traders that when the "net position" reaches significantly high values, it could be indicative of an upward trend nearing its climax. This is echoed by the first indicator, where a noticeable divergence between the red and green lines can be observed, a scenario that frequently foreshadows the conclusion of a trend. As per the latest report, the "Non-commercial" group recorded a decrease of 12,000 in buy contracts, whereas shorts saw an uptick of 10,200. This resulted in a net reduction of 22,200 contracts in their position. The number of buy contracts exceeds the number of sell contracts by 150,000 among non-commercial traders, which is a considerable gap, more than threefold in difference. Fundamentally, even without COT reports, it's clear that the European currency should be declining, but the market still isn't rushing to sell.
Trading plan for the week of August 14–18:
In the 24-hour timeframe, the pair worked off the 61.8% Fibonacci level at 1.1270 and began a downward correction. The price surpassed the critical line, so opening long positions without new buying signals is not recommended. At the same time, the pair worked off the 50.0% Fibonacci level, which it hasn't been able to surpass for two weeks. Thus, the upward movement might theoretically resume next week. We advocate for continuing the euro's decline, but the market has repeatedly shown a lack of strong enthusiasm for this.
As for selling the euro/dollar pair, one can support or open them on the 24-hour TF, but the significant 50.0% Fibonacci level has halted the decline. Of course, the decline doesn't necessarily have to be rapid, and the level might be surpassed next week. Right now, we see that the euro is ready to lose an average of 100 points per week, which is quite minimal. However, the decline should continue, at least to the Senkou Span B line.
Notes to illustrations:
Price levels of support and resistance, Fibonacci levels – are targets when opening buys or sells. Take Profit levels can be placed around them.
Indicators: Ichimoku (standard settings), Bollinger Bands (standard settings), MACD (5, 34, 5).
Indicator 1 on COT charts – the size of the net position for each category of traders.
Indicator 2 on COT charts – the net position size for the "Non-commercial" group.


