


To open long positions on GBP/USD:
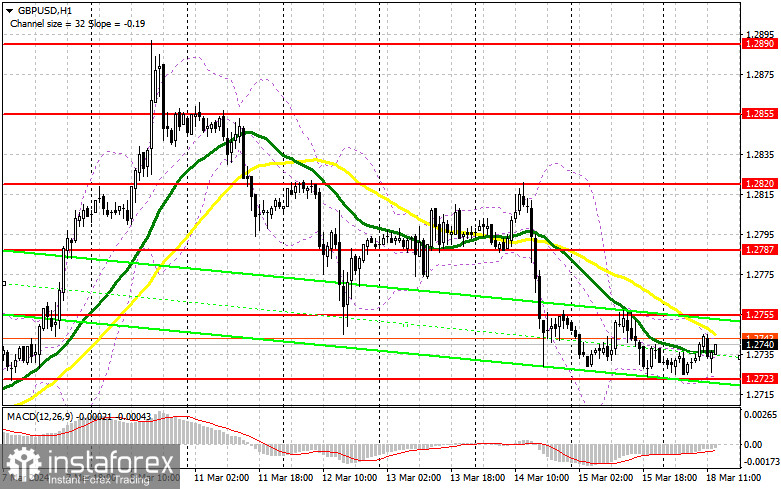
Considering the absence of statistics from the UK, the pound has remained within a sideways channel with a high probability of further decline. But for this, good US statistics are needed. However, in the second half of the day, we only have figures on the US housing market index from NAHB, so buyers should not be discounted. In case of a pair's decline, only the formation of a false breakout around the nearest support at 1.2723 will provide a suitable entry point into long positions, counting on a return of demand for the pound with the prospect of updating 1.2755 resistance, which we have not yet reached. A breakout and consolidation above this range will strengthen the bulls' positions and open the way to 1.2787, where the moving averages supporting the bears are located. The ultimate target will be a maximum of 1.2820, where I plan to make a profit. In the scenario of a pair's decline and the absence of bullish activity at 1.2723, all this will be possible in the case of strong US data, the pair will continue its decline. In this case, only a false breakout around the next support at 1.2691 will confirm the correct entry point into the market. I plan to buy GBP/USD immediately on a rebound from the minimum of 1.2666 with a target of a 30-35 point correction within the day.
To open short positions on GBP/USD:
Considering that volatility is very low, bears have every chance of further pair decline. A false breakout around the resistance at 1.2755 in case of a reaction to US data will confirm the correct entry point for selling in continuation of the trend, leading to a downward movement to around 1.2723. A breakout and reverse test of this range from bottom to top will deal another blow to the bulls' positions, leading to stop orders being triggered and opening the way to 1.2691. There I expect the presence of large buyers. The ultimate target will be the area of 1.2666, where profit will be taken. In the scenario of GBP/USD growth and the absence of activity at 1.2755 in the second half of the day, buyers will feel strength in anticipation of a small upward correction. In this case, I will postpone sales until the false breakout at the level of 1.2787, where the moving averages are located. If there is no downward movement there, I will sell GBP/USD immediately on a rebound from 1.2820, but only counting on a pair correction downwards by 30-35 points within the day.
Indicator signals:
Moving averages
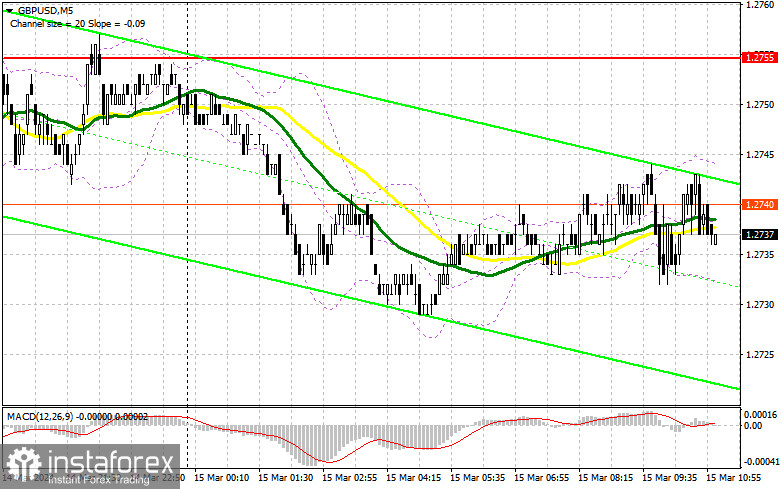
Trading is conducted below the 30 and 50-day moving averages, indicating further pair decline.
Note: The period and prices of moving averages are considered by the author on the hourly chart H1 and differ from the general definition of classical daily moving averages on the daily chart D1.
Bollinger Bands
In case of a decline, the lower boundary of the indicator around 1.2723 will act as support.
Description of Indicators
- Moving average (determines the current trend by smoothing volatility and noise). Period 50. Marked on the chart in yellow.
- Moving average (determines the current trend by smoothing volatility and noise). Period 30. Marked on the chart in green.
- MACD indicator (Moving Average Convergence/Divergence) Fast EMA period 12. Slow EMA period 26. SMA period 9
- Bollinger Bands. Period 20
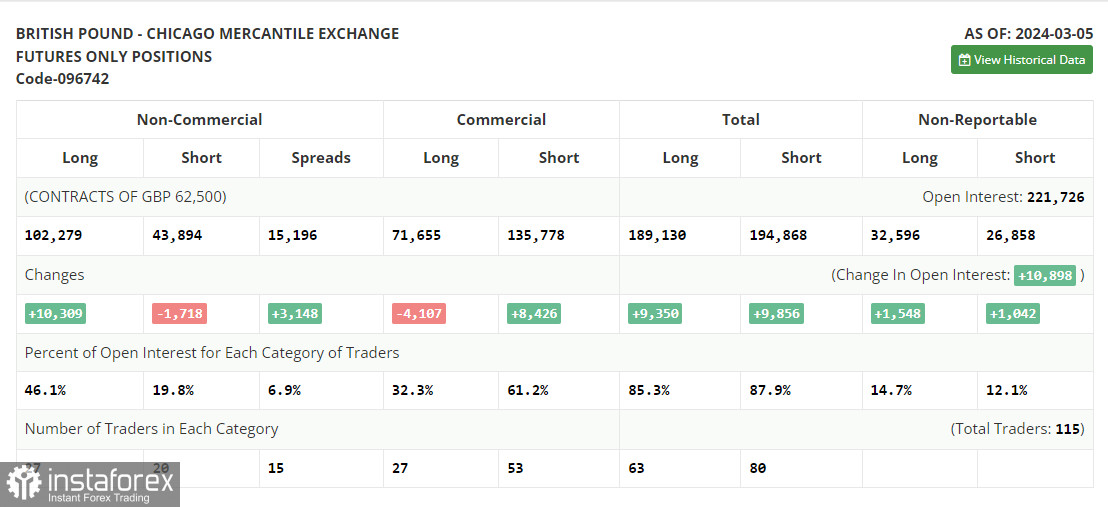
- Non-commercial traders - speculators, such as individual traders, hedge funds, and large institutions, use the futures market for speculative purposes and meet certain requirements.
- Long non-commercial positions represent the total long open position of non-commercial traders.
- Short non-commercial positions represent the total short open positions of non-commercial traders.
- The total non-commercial net position is the difference between the short and long positions of non-commercial traders.


