


EUR/USD
Análise:
A curto prazo, a direção do movimento do preço do euro no par principal tem sido moldada por uma onda ascendente desde fevereiro. Nos últimos seis meses, o par tem formado uma seção corretiva do padrão de onda (B), que permanece inacabada. A onda tem a forma de uma flat em contração. As cotações estão se movendo ao longo dos limites de uma zona de reversão potencial em um período gráfico maior.
Previsão:
No início da próxima semana, espera-se que a moeda europeia continue em movimento lateral. Perto da zona de suporte, as flutuações de preço podem entrar em um padrão horizontal. A formação de um sinal de reversão e o início de um movimento de alta tornam-se mais prováveis na segunda metade da semana. O momento pode coincidir com a divulgação de notícias econômicas importantes.

Zonas de reversão potenciais
Resistência:
- 1.1690 / 1.1740
Suporte:
- 1.1550 / 1.1500
Recomendações:
- Compra: Preferível após o aparecimento de sinais de reversão perto da área de suporte
- Venda: Não há condições para estas transações.
USD/JPY
Análise:
No gráfico do par principal do iene japonês, a tendência de curto prazo é dominada por um movimento de alta. Seu segmento final, ainda não concluído, está em desenvolvimento desde 1º de outubro. Os preços entraram na faixa de uma possível zona de reversão no período semanal, aproximando-se de seu limite superior. O movimento de baixa iniciado em 20 de novembro carrega potencial de reversão.
Previsão:
Na próxima semana, espera-se um movimento de queda no preço, possivelmente alcançando a zona de suporte projetada. Em seguida, é provável que o mercado entre em um movimento lateral. Depois disso, aumenta a probabilidade de uma reversão de tendência e de uma retomada da alta do par. A área de resistência calculada indica o limite superior potencial do movimento semanal.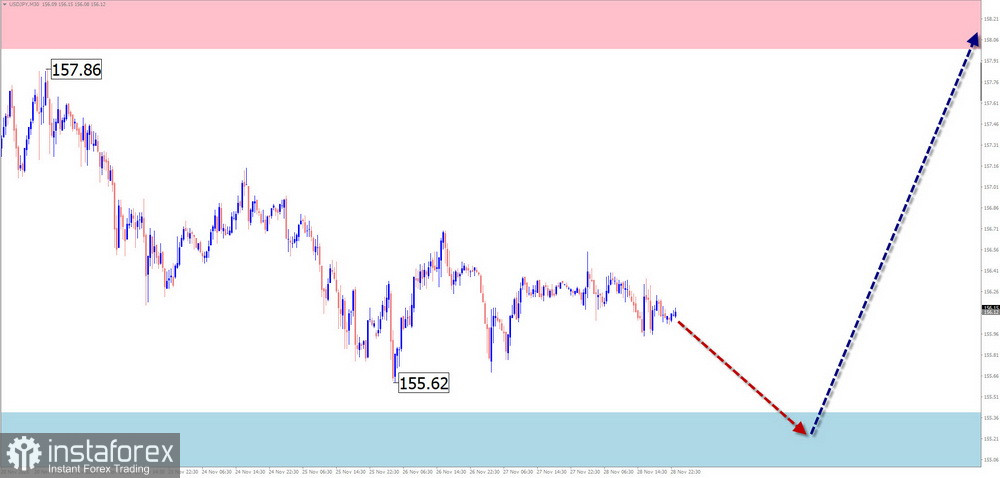
Zonas de reversão potenciais
Resistência:
- 158.00 / 158.50
Suporte:
- 155.40 / 154.90
Recomendações:
- Compra: possível após o aparecimento de sinais de reversão confirmados perto da área de suporte.
- Venda: Arriscada, com baixo potencial.
Bitcoin
Análise breve:
No gráfico semanal do Bitcoin, a direção da tendência nos últimos anos tem sido moldada por um movimento de alta em forma de zigue-zague. Desde novembro do ano passado, os preços vêm passando por uma correção, formando um padrão lateral prolongado. O trecho final (C) está atualmente em desenvolvimento. A faixa superior da zona potencial de reversão no período mensal se encontra na região dos 75 mil dólares.
Previsão:
Nos próximos dias, é altamente provável que o movimento ascendente do Bitcoin continue. Não se descarta uma pressão temporária sobre o limite superior da resistência. Após isso, uma reversão e um retorno ao declínio são esperados. A zona de suporte indica o limite superior da área-alvo prevista.

Zonas de reversão potenciais
Resistência:
- 93,700.0 / 95,700.0
Suporte:
- 75,000.0 / 73,000.0
Recomendações:
- Compra: Altamente arriscado e pode levar a perdas.
- Venda: Pode ser utilizada assim que surgirem sinais adequados perto da zona de resistência.
Ethereum
Análise breve:
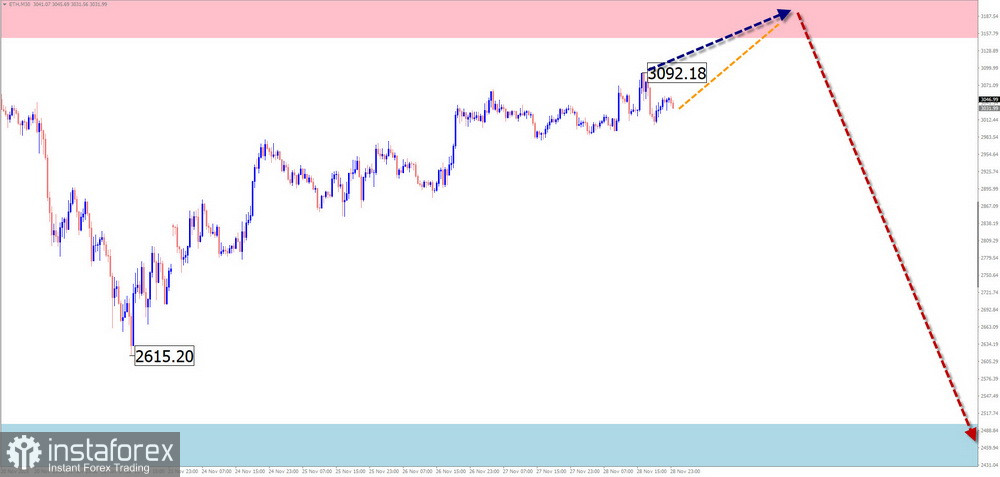
No gráfico semanal do Ethereum, uma estrutura de onda descendente vem se formando desde meados de agosto deste ano. A onda ainda não completou seu segmento final. Dentro da última parte (C), está se desenvolvendo um recuo intermediário de alta.
Previsão:
Ao longo da próxima semana, espera-se que o Ethereum continue em um movimento predominantemente lateral, mas com leve viés de alta. Uma reversão é esperada próximo à zona de resistência. A partir de dezembro, é provável o aumento da volatilidade e o início de uma fase mais ativa de movimento descendente. O alvo final do movimento de alta atual está localizado na zona de suporte calculada.
Zonas de reversão potenciais
Resistência:
- 3,150.00 / 3,200.00
Suporte:
- 2,500.00 / 2,450.00
Recomendações:
- Compra: possível com um volume reduzido e com potencial movimento em direção à zona de resistência.
- Venda: prematura até que sinais de reversão confirmados apareçam perto da resistência.
Litecoin
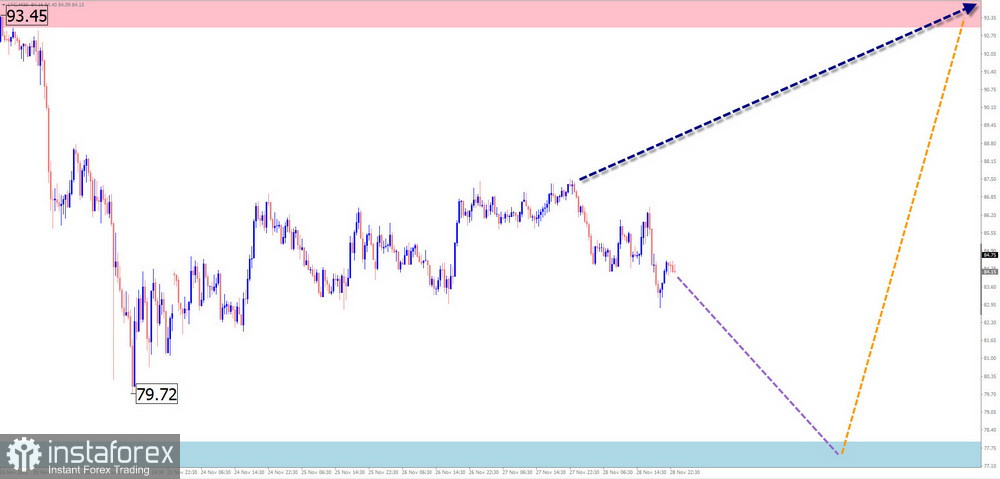
A estrutura de ondas mais recente e ainda incompleta do Litecoin apresenta um vetor de baixa. Na onda semanal de maior escala, esse segmento aparece no final de um flat corretivo. O corredor de preços formado pelas cotações delineou um padrão gráfico de "bandeira". A estrutura de ondas não mostra sinais de conclusão.
Previsão semanal:
Nos próximos dias, é altamente provável que o Litecoin continue seu movimento de queda até alcançar a zona de suporte. Depois disso, pode ocorrer uma fase lateral, criando condições para uma reversão e um avanço em direção à zona de resistência. A zona de suporte está situada no limite inferior da forte área potencial de reversão.
Zonas de reversão potenciais
Resistência:
- 93.00 / 94.00
Suporte:
- 78.00 / 77.050
Recomendações:
- Compra: Será relevante assim que surgirem sinais confirmados de reversão.
- Venda: Sem condições até que a onda atual se complete.
Ripple
Análise breve:
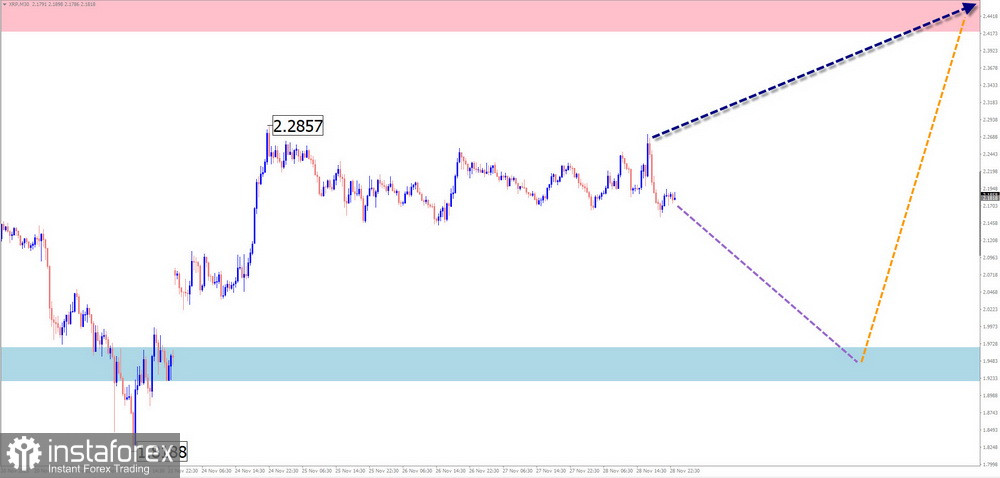
No gráfico semanal do Ripple, a onda de baixa iniciada em novembro do ano passado está se aproximando da conclusão. No modelo de ondas de maior escala, esse movimento representa uma correção. A partir do limite superior de uma forte zona de reversão, uma onda corretiva de alta começou há uma semana.
Previsão semanal:
Nos próximos dias, o preço do Ripple deverá se mover predominantemente de forma lateral. Um recuo em direção à zona de suporte é possível. Após isso, uma reversão e uma retomada do movimento de alta são prováveis. Um aumento de atividade é mais provável no final da semana.
Zonas de reversão potenciais
Resistência:
- 2.4200 / 2.4700
Suporte:
- 1.9700 / 1.9200
Recomendações:
- Venda: Pode ser utilizada em operações individuais com volume reduzido.
- Compra: Sem condições até que sinais confirmados de reversão apareçam próximos à zona de suporte.
Observações: Na Análise Simplificada de Ondas (SWA), todas as ondas são compostas por 3 partes (A-B-C). Em cada período gráfico, analisamos a última onda inacabada. As linhas tracejadas indicam os movimentos esperados.
Atenção: O algoritmo de ondas não leva em consideração a duração dos movimentos de preço ao longo do tempo!


