

















Main Quotes Calendar Forum
flag

FX.co ★ EUR/USD

back
Trader Journals:::2026-05-27T00:39:29

EUR/USD

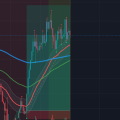
The chart displayed is actually EUR/USD on the lower intraday timeframe, but the technical structure still provides clear directional insight similar to an H1 trend study. Price action remains firmly bullish after a strong impulsive rally from the left side of the chart, where buyers aggressively defended the moving average cluster and initiated a sustained upward breakout. The red short term moving average has crossed above the gray dynamic average, while both remain significantly above the green medium term trend line and the blue long term baseline, confirming a healthy bullish alignment. Momentum accelerated sharply during the middle portion of the chart as consecutive bullish candles formed higher highs and higher lows with very limited retracement pressure. Volume also expanded during the breakout phase, indicating genuine institutional participation rather than weak speculative buying. Although price experienced a temporary correction near the recent peak, buyers quickly regained control and pushed the pair back toward resistance, showing that bullish sentiment remains dominant. The latest candles are consolidating in a tight range near the highs, which usually signals continuation rather than reversal unless heavy bearish volume appears. Immediate resistance is located around the recent swing high near 1.1645, and a confirmed breakout above this level could open the path toward another impulsive extension. On the downside, initial support is visible around the red moving average zone near 1.1630, followed by stronger support around the green trend line near 1.1615. As long as price remains above these dynamic support areas, the broader outlook favors bullish continuation. However, traders should remain cautious of short term pullbacks because the market appears slightly overextended after the aggressive rally, and profit taking could trigger temporary volatility before the next upward movement begins. If buyers maintain control above the consolidation band, trend followers may continue targeting resistance zones, while any decisive break beneath the moving average would weaken momentum and increase the probability of a corrective retracement during sessions

EUR/USD

The chart displayed appears to be EUR/USD on the 1-minute timeframe rather than XAU/USD H1, but the technical structure can still be analyzed clearly from the current price action. The market is maintaining a strong bullish trend, supported by a sequence of higher highs and higher lows across the session. Price has remained consistently above the major moving averages, with the fast red moving average crossing and holding above the medium gray and green averages, confirming positive short-term momentum. In addition, the long-term blue moving average is sloping upward steadily, showing that the broader intraday trend remains bullish and buyers still control the market direction. The sharp impulsive rally in the middle of the chart indicates strong buying pressure supported by rising volume activity, especially during breakout candles where momentum accelerated aggressively. After reaching the recent high near the upper resistance zone, price entered a consolidation phase with tighter candles and repeated rejection wicks, suggesting temporary profit-taking rather than a complete reversal. The current sideways movement above the moving averages reflects bullish continuation behavior, where the market is gathering liquidity before attempting another upward breakout. Immediate resistance is located around the recent swing highs, and a successful break above this level could trigger another bullish expansion toward higher intraday targets. On the downside, the nearest support is positioned around the red and gray moving average cluster, while stronger dynamic support remains near the green moving average. If price falls below these supports with increasing bearish volume, a deeper corrective pullback toward the blue long-term average may develop. However, as long as candles continue closing above the medium-term averages and buying volume remains stable, the overall bias stays bullish. Traders should monitor breakout confirmation, candle strength, and volume behavior closely because sustained momentum above resistance would favor further upside continuation, while rejection from current highs may produce a short-term corrective retracement before the primary bullish trend resumes again.
photo
Forum user
Share this article:
back
loader...
all-was_read__icon
You have watched all the best publications
presently.
We are already looking for something interesting for you...
all-was_read__star
Recently published:
loader...
More recent publications...

