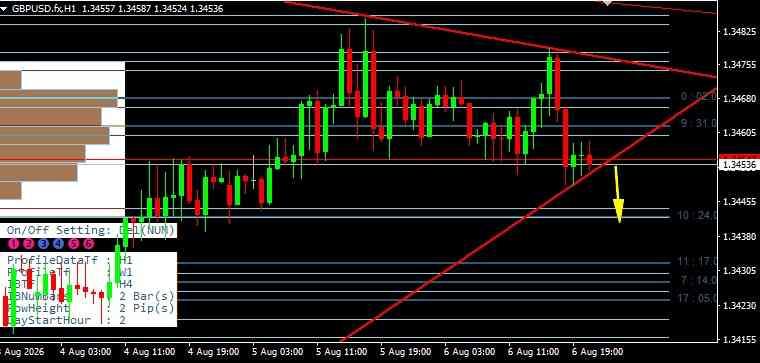
Greetings, colleagues. The current price of the GBP/USD pair is 1.43536. I am analyzing the hourly chart. Strong bearish pressure is developing in the market. The bears are actively pushing the quotes down. The asset has broken an important descending support line. I expect a further decline in price. From above, the GBP/USD pair has been squeezed into a triangle. The upper red descending line acts as strong resistance. The chart has formed local highs and moved down. The bullish spike of the last few hours has been completely neutralized. Right now we are seeing a technical sell-off in the market. On the left side of the chart, a volume shelf is visible. The horizontal histogram shows a strong distribution of forces. The bears managed to gain a foothold below the main accumulation. The price is trading below the 1.43605 level. This confirms the strength of the sellers. My main target for GBP/USD is lower. I plan to go short. I will open sell positions from current prices. The first profit-taking target is at the 1.43455 level. I expect a strong impulse toward this support. Buyers have completely lost the initiative. The market is preparing to test lower levels. I am hiding my stop behind the local highs slightly above the 1.43605 level. The movement potential is good. The risk here is minimal. I expect a drop to the local support. A breakout of the 1.43455 mark will open the way to the 1.43380 level. The situation for the GBP/USD pair on H1 looks bearish (short).