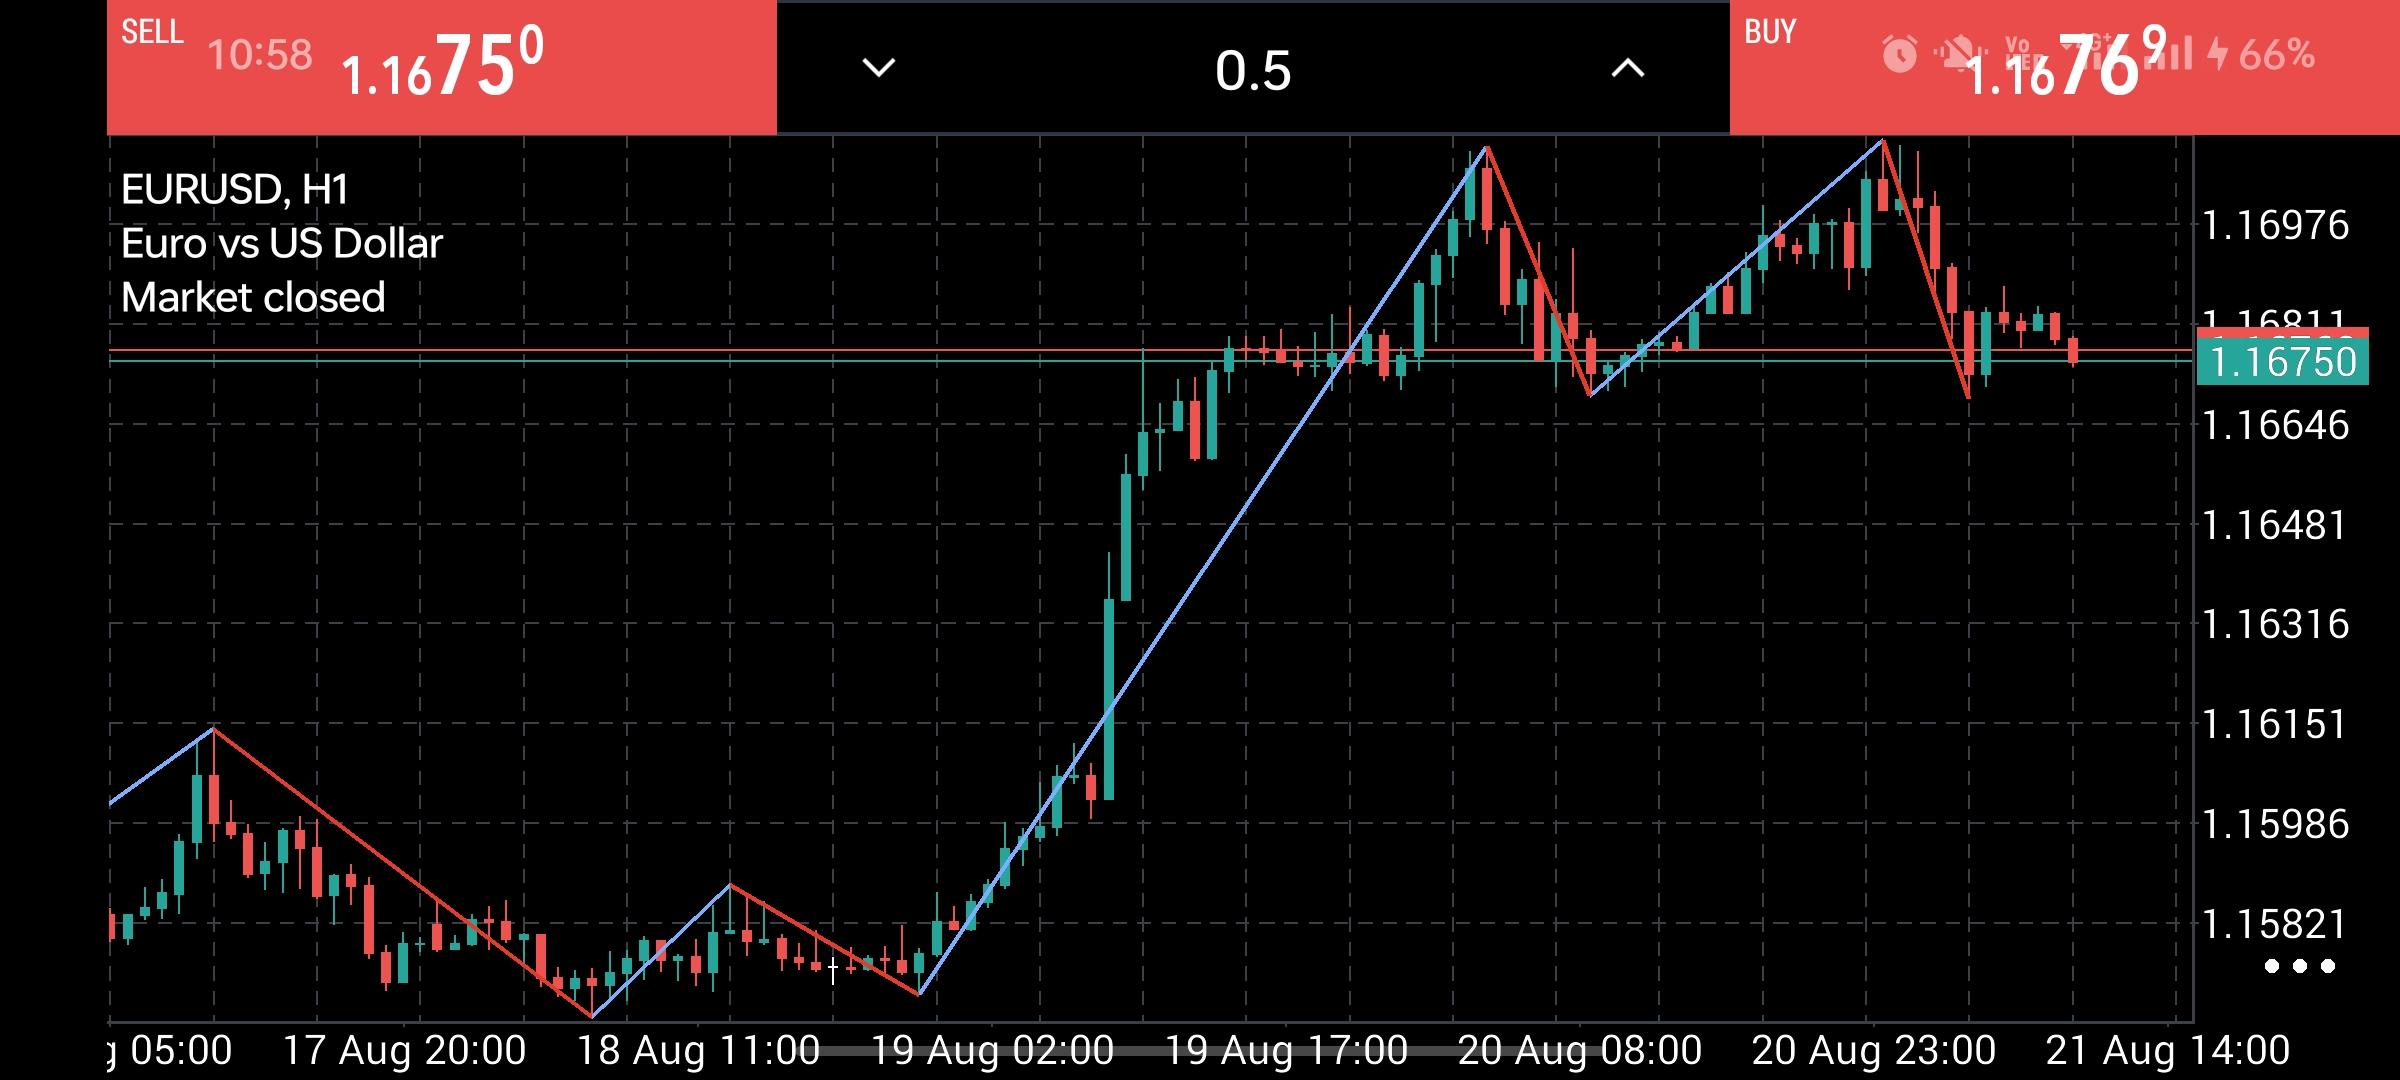
This chart shows the
EUR/USD currency pair on the
1-Hour timeframe, utilizing a
ZigZag indicator (the alternating blue and red diagonal lines to filter out market noise and highlight significant swing highs and swing lows.
Key Technical Observations Trend Structure & Wave Patterns: 17 Aug – 19 Aug Base Building: The pair established a bottom near 1.15821 on August 18th after an initial decline, followed by a higher low on August 19th before breaking higher.
19 Aug – 20 Aug Strong Impulse Move: A sharp bullish expansion pushed prices rapidly from 1.15821 to a local peak around 1.16976.
20 Aug – 21 Aug Double Top / Distribution: The ZigZag lines clearly highlight a
Double Top reversal pattern at 1.16976. The market retested this high, failed to break higher, and sold off back toward the current price of
1.16750.
Key Support & Resistance Levels: Resistance: 1.16976 Strong ceiling / recent high.
Horizontal Level / Neckline: Around 1.16750 – 1.16811 Current consolidation zone marked by horizontal lines.
Key Support: 1.16646 Intermediary dip level), followed by lower support near 1.15821.
Current Market State The market status indicates
"Market closed" with the bid price sitting at
1.16750. The price is currently resting right on the horizontal support line, completing the right leg of the double top pattern. To tailor an actionable trading plan or risk analysis for this chart, could you share a bit more context? What is your overall trading strategy or time horizon e.g., intraday swing, scalp? What is your preferred risk tolerance or position sizing for Forex trades
EUR/USD H1 Technical Analysis Current price: 1.16750 The EUR/USD H1 chart shows a
strong bullish trend followed by consolidation and a short-term correction. Price advanced sharply from around
1.1560 toward 1.1700, creating higher highs and higher lows. However, the pair has faced strong resistance around
1.1695–1.1700, where sellers have appeared twice. The recent price action is now moving sideways around
1.1675, indicating that the market is waiting for a breakout.
Trend Structure 1.1700 MAJOR RESISTANCE 1.1690 Resistance 1.1675 CURRENT PRICE ↔ Consolidation 1.1664 SUPPORT 1.1648 NEXT SUPPORT 1.1631 STRONGER SUPPORT
Bullish Scenario If price breaks and
closes above 1.1690–1.1700 on H1, bullish momentum could return.
Potential targets: TP1: 1.1710
TP2: 1.1725
TP3: 1.1740 A sustained breakout above
1.1700 would invalidate the current double-top resistance and favor further upside.
Bearish Scenario If EUR/USD fails to break 1.1690–1.1700 and falls below
1.1664, the short-term correction could extend.
Potential downside levels: TP1: 1.1648
TP2: 1.1631
TP3: 1.1615 A clean H1 close below
1.1648 would make the short-term structure considerably more bearish.
Key Levels 1.1700 Major resistance
1.1690 Resistance
1.1675 Current price
1.1664 Immediate support
1.1648 Support
1.1631 Strong support
1.1615 Deeper support
Overall Bias Short-term: Neutral → Slightly bullish above 1.1664. Medium-term H1: Bullish, because the larger move still shows higher highs and higher lows. The most important area is
1.1690–1.1700. A confirmed breakout above this zone would favor BUY continuation, while a break below
1.1664 would increase the probability of a SELL correction.
Best approach: wait for an H1 candle close outside the
1.1664–1.1700 range rather than entering in the middle of the consolidation.