


The index remains bearish below the 200 SMA at H1 chart and the support level of 93.55 is still helping to contain further bearish advance in the short-term. If that level gives up, then we might expect a leg lower to test the 93.12 zone. To the upside, the 200 SMA at H1 chart is the nearest resistance to pierce.
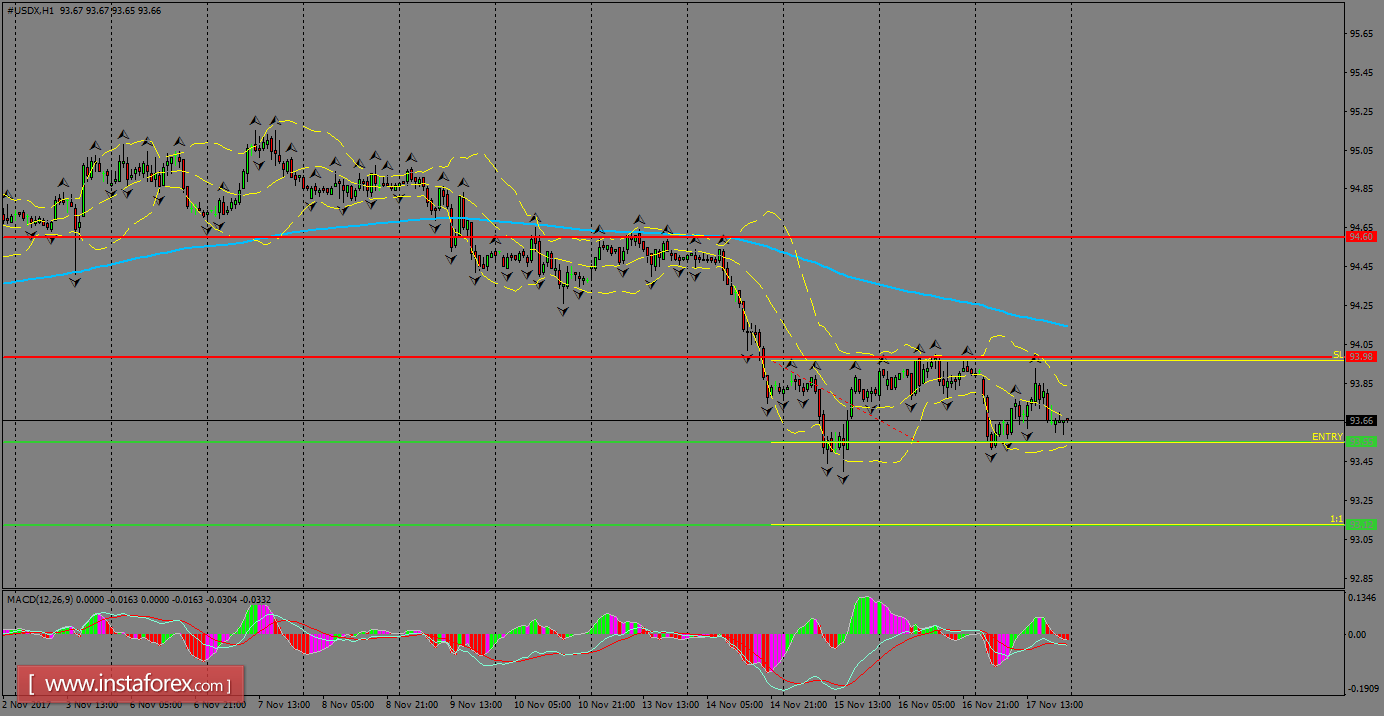
H1 chart's resistance levels: 93.98 / 94.60
H1 chart's support levels: 93.55 / 93.12
Trading recommendations for today: Based on the H1 chart, place sell (short) orders only if the USD Index breaks with a bearish candlestick; the support level is at 93.55, take profit is at 93.12 and stop loss is at 93.97.


