


To open long positions on EURUSD, you need to:
In my morning forecast, I paid attention to several rather interesting levels from which two signals were formed to enter the market. Let's look at a 5-minute chart and analyze them. A false breakout and a return of EUR/USD to the resistance level of 1.1663 formed a good entry point for short positions. However, the movement was not more than 35 points down, although this was enough. Already during the repeated test, the bulls managed to gain a foothold above the level of 1.1663, testing it from the top down, which led to the formation of a signal to buy the euro, which is now being worked out.
Para abrir posiciones largas en EUR/USD, usted necesita:
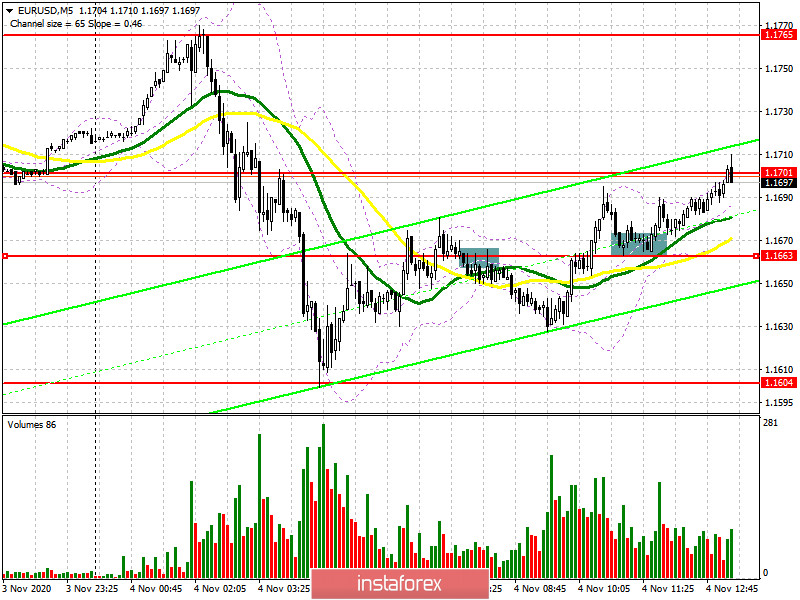
The Eurozone's services sector proved more than resilient to the spread of the coronavirus and did not show a serious decline in October, which played in favor of the strengthening of the European currency. At the moment, the primary task of the bulls will be to break through and consolidate above the resistance of 1.1701. A test of this level, similar to the morning purchase, will lead to the formation of a new signal to open long positions with an exit to a maximum of 1.1765, where I recommend fixing the profits. Equally important will be the report on the US service sector. Good data may lead to a downward correction of the pair to the support area of 1.1655, which was formed this morning. The formation of a false breakout at this level will be a signal to open long positions in the continuation of the upward trend. If the bulls do not show activity in this range, it is best to postpone long positions until the monthly low of 1.1604 is updated, based on a correction of 15-20 points within the day.
To open short positions on EURUSD, you need to:
Sellers need to protect the resistance of 1.1701, as only it keeps the pair from a new, larger wave of euro growth. An unsuccessful consolidation at this level, followed by a return under it and a test from the bottom up, will be a signal to open short positions in the continuation of the downward trend formed this morning. But an equally important goal of the bears will be to break through and consolidate below the support of 1.1655, the test of which from the bottom up will form another point for selling EUR/USD with an exit to the minimum of 1.1604. A breakthrough in this area will depend entirely on the results of the US election. A break of 1.1604 will open a direct road to the lows of 1.1541 and 1.1490. If the bears do not show any activity in the area of 1.1701 in the second half of the day, and the data on the US services sector disappoints, then it is best to postpone short positions until the high of 1.1675 is updated or sell EUR/USD immediately for a rebound from the resistance of 1.1835 in the expectation of a correction of 20-30 points within the day.
Let me remind you that the COT report (Commitment of Traders) for October 27 recorded a reduction in both long and short positions. But despite this, buyers of risky assets believe in the continuation of the bull market and prefer to act cautiously. Thus, long non-profit positions fell from 229,878 to 217,443, while short non-profit positions also fell to 61,888 from 63,935. The total non-commercial net position fell to 155,555, down from 165,943 a week earlier. However, bullish sentiment for the euro remains quite high in the medium term. The stronger the euro declines against the US dollar at the end of this year, the more attractive it will be for new investors, especially after the US presidential election, when additional pressure on the market on this issue will ease.
Signals of indicators:
Moving averages
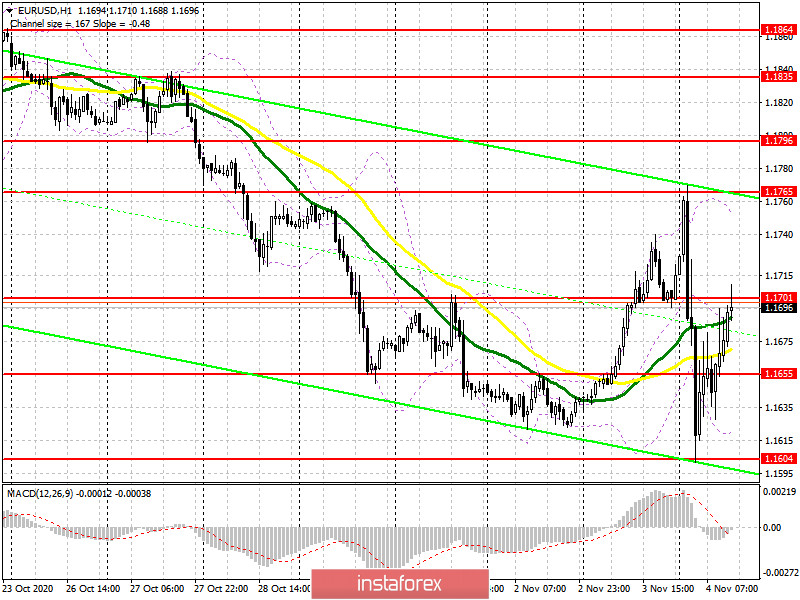
Trading is conducted in the area of 30 and 50 daily moving averages, which indicates an active confrontation between buyers and sellers.
Note: The period and prices of moving averages are considered by the author on the hourly chart H1 and differ from the general definition of classic daily moving averages on the daily chart D1.
Bollinger Bands
In the case of growth, the movement will be limited to the upper level of the indicator in the area of 1.1760. A break in the lower limit of the indicator around 1.1610 will lead to a larger movement of the euro down.
Description of indicators
- Moving average (moving average determines the current trend by smoothing out volatility and noise). Period 50. The graph is marked in yellow.
- Moving average (moving average determines the current trend by smoothing out volatility and noise). Period 30. The graph is marked in green.
- MACD indicator (Moving Average Convergence / Divergence - moving average convergence / divergence) Fast EMA period 12. Slow EMA period 26. SMA period 9
- Bollinger Bands (Bollinger Bands). Period 20
- Non-profit speculative traders, such as individual traders, hedge funds, and large institutions that use the futures market for speculative purposes and meet certain requirements.
- Long non-commercial positions represent the total long open position of non-commercial traders.
- Short non-commercial positions represent the total short open position of non-commercial traders.
- Total non-commercial net position is the difference between the short and long positions of non-commercial traders.


