


















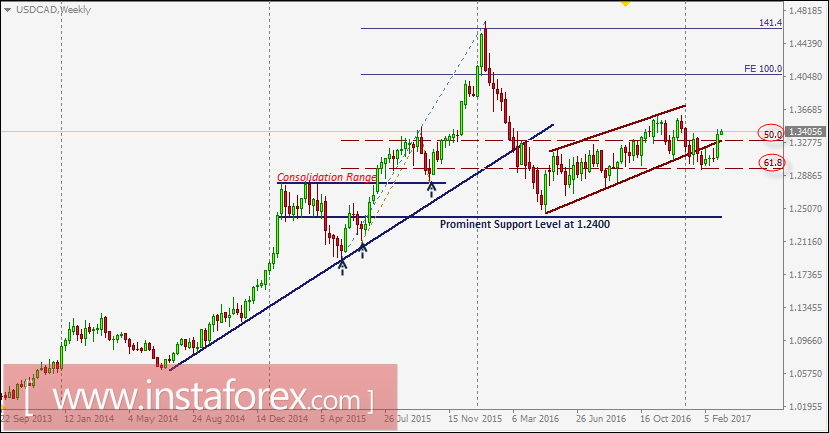
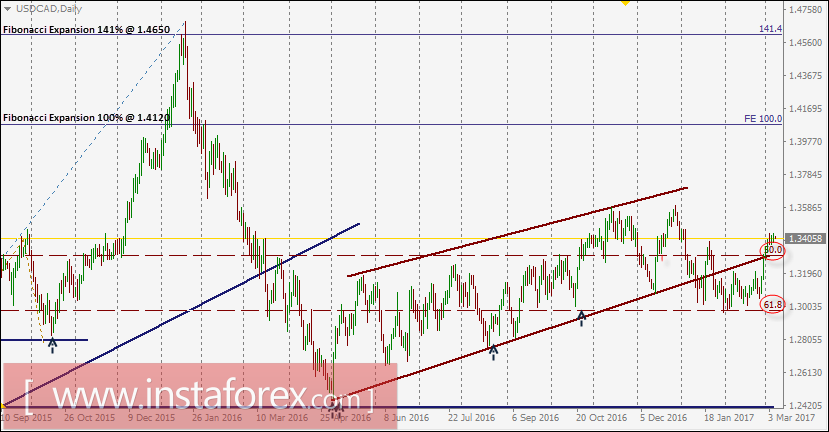
The USD/CAD pair challenged the upper limit of the depicted channel around 1.3360-1.3400 which succeeded to apply enough bearish pressure on the pair.
Shortly after, a bearish engulfing weekly candlestick was expressed by the end of the week indicating strong resistance around 1.3550.
Bearish persistence below the price level of 1.3300 (50% Fibonacci Level) was achieved.
This allowed a further decline toward 1.3200 and 1.3080 (the lower limit of the depicted channel) where bullish rejection was expressed as anticipated.
A bullish breakout above 1.3360 (50% Fibonacci level) was expected to allow a further advance toward 1.3700-1.3750 (the upper limit of the depicted channel). However, significant bearish rejection was expressed around 1.3580 (recent established top).
El nivel de precio de 1.3300 (nivel 50% Fibonacci) no logró proveer suficiente soporte para el reciente retroceso bajista.
Por esta razón el retroceso bajista reciente hacia 1.2970 (nivel 61.8% Fibonacci) ofreció una entrada válida de COMPRA como se esperaba en los artículos previos.
Esta semana , la ruptura alcista actual sobre 1.3300 (nivel 50% Fibonacci) realza más avance alcista hacia 1.3440 y 1.3550.
De otro modo, el par USD/CAD permanece atrapado dentro del rango de consolidación actual (1.2970-1.3300).


