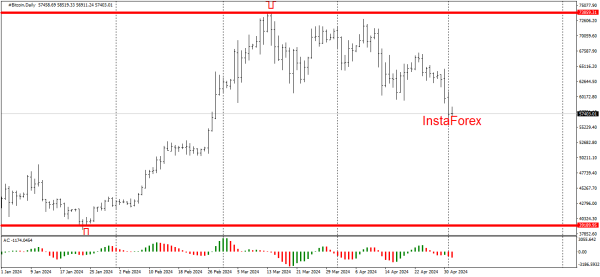
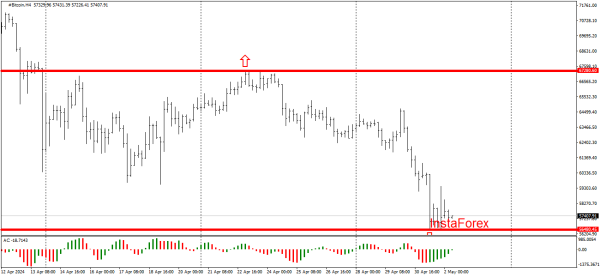
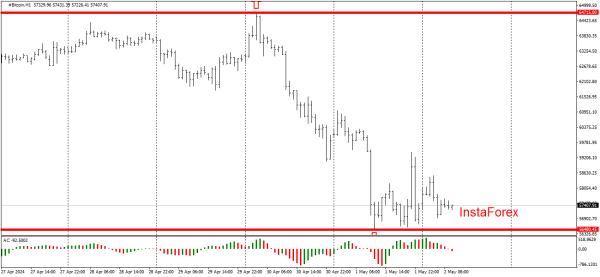
#Bitcoin. 2.5.2024. Thursday. Hello colleagues in currency trading! For those working on the daily timeframe, which means long-term trades, the buying and selling price is 73859.31 upwards, and downwards at 39189.95. Observing the H4 timeframe, the chart clearly shows breakout levels located at 67280.60 - upwards and downwards at 56480.45. And only by looking at the hourly timeframe, we will see the level for buying/selling at 64715.00 and 56480.45. When the hourly candle closes beyond the level, we enter the trade. For Buy: StopLoss - 64714.00 TakeProfit - 64718.00. For Sell: StopLoss - 56481.45 TakeProfit - 56477.45. Exiting the trade only at TP or SL. In other scenarios, costs may increase and profits decrease. Before entering the market, make sure to confirm the corresponding signal on the Accelerator Oscillator indicator. Green bars should appear for buying, and red bars for selling.


