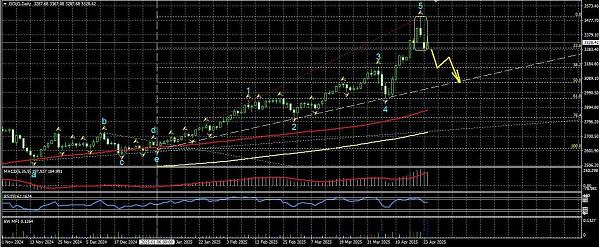
In the gold market, the technical situation has changed drastically: now the downward movement of its quotes will be primary, and any northward pullback will be perceived as a correction. As confirmation of this fact, on the daily chart, there is a candlestick reversal pattern "Dark Cloud Cover", and on the H4 - "Evening Star". Considering the daily timeframe, this southern trend of the metal may have a solid price range. Looking at the daily gold chart, we can note a fully formed ascending impulsive structure with a price range from 2614 to 3500, which was formed after a horizontal triangle. Now the main intrigue is whether this impulse is the final formation, as the triangle is the penultimate figure in the composition of senior wave models? This depends on which corrective wave the mentioned triangle represents. If it acts as wave "B" of an ascending single zigzag, then the mentioned impulse is the final wave "C", and a significant decline in the metal is expected, down to the end of the triangle (level 2614). If it serves as the connecting wave "X" of a double zigzag, then the southern correction of gold will be more modest within the Fibonacci ratio grid depicted on the chart, as this correction will be considered as an internal wave "b" of the second zigzag after the triangle. It can be noted that the strongest support level of the metal is at the 61.8% Fibonacci level (value 2955), which is also a mirror level. In any case, the minimum target decline for gold is considered to be the area of testing the lower trend line of the daily ascending channel, and further developments will be visible.