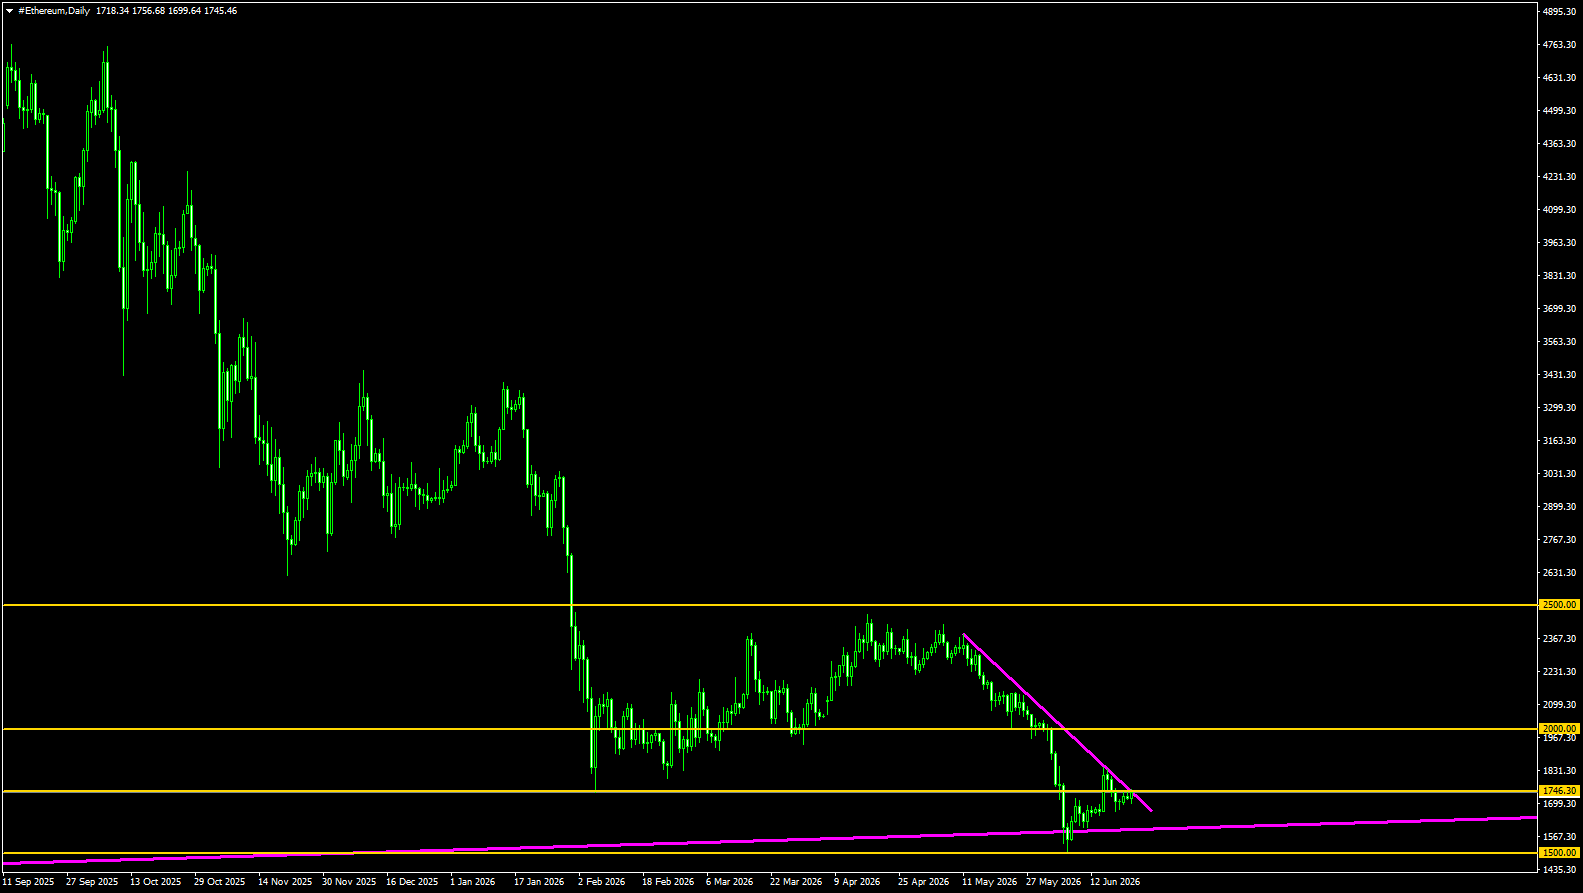
The price of Ethereum continues to knock on the resistance level of 1745. If today or in the near future it manages to break through upwards, then further price growth towards the levels of 1920 and 2000 can be expected. In this area, there is a resistance zone from which a new downward wave on the chart can be obtained. If the current resistance cannot be broken, then I expect a resumption of the decline towards the current minimum of 1500. A renewed attack on this support is likely to end with a breakthrough and further price decline of the asset to new multi-month lows around 1410 and below. We are waiting for a resolution.