


FX.co ★ Actual patterns. Technical analysis and trading recommendations
实际图案

Triple Bottom

The Triple Bottom pattern has been formed on #INTC M5. It has the following characteristics: resistance level 97.48/96.35; support level 95.37/95.39; the width is 211 points. In the event of a breakdown of the resistance level of 97.48, the price is likely to continue an upward movement at least to 95.15.
Double Bottom

The Double Bottom pattern has been formed on #INTC M5. This formation signals a reversal of the trend from downwards to upwards. The signal is that a buy trade should be opened after the upper boundary of the pattern 100.83 is broken. The further movements will rely on the width of the current pattern 140 points.
在交易员论坛上
注册 赚钱!
Double Bottom
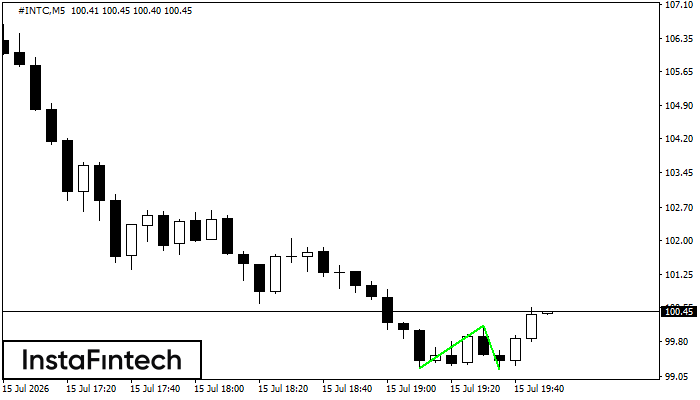
The Double Bottom pattern has been formed on #INTC M5. This formation signals a reversal of the trend from downwards to upwards. The signal is that a buy trade should be opened after the upper boundary of the pattern 100.15 is broken. The further movements will rely on the width of the current pattern 92 points.
Double Top
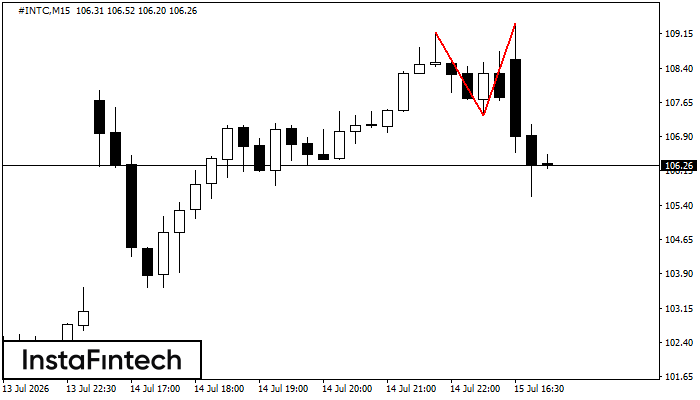
The Double Top pattern has been formed on #INTC M15. It signals that the trend has been changed from upwards to downwards. Probably, if the base of the pattern 107.36 is broken, the downward movement will continue.
Bearish pennant
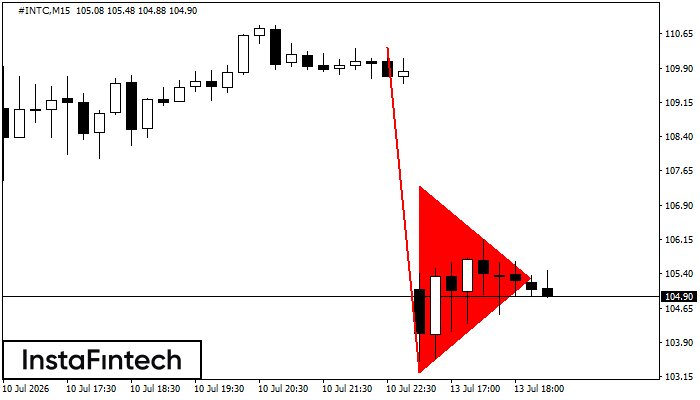
The Bearish pennant pattern has formed on the #INTC M15 chart. It signals potential continuation of the existing trend. Specifications: the pattern’s bottom has the coordinate of 103.25; the projection of the flagpole height is equal to 709 pips. In case the price breaks out the pattern’s bottom of 103.25, the downtrend is expected to continue for further level 103.03.


