


FX.co ★ Actual patterns. Technical analysis and trading recommendations
实际图案

Bullish pennant

The Bullish pennant pattern is formed on the #NTDOY M30 chart. It is a type of the continuation pattern. Supposedly, in case the price is fixed above the pennant’s high of 12.19, a further uptrend is possible.
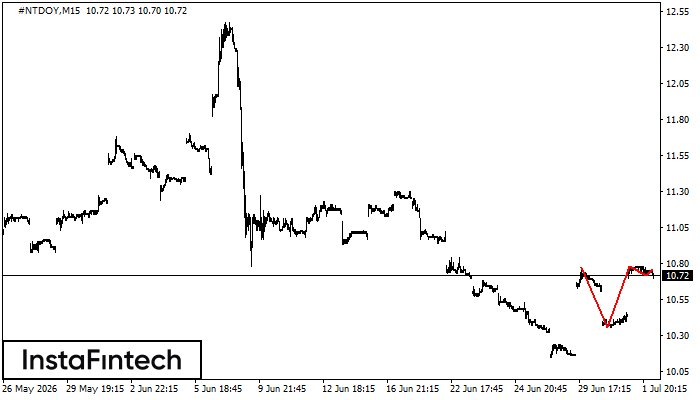
Bullish pennant

The Bullish pennant pattern is formed on the #NTDOY M15 chart. It is a type of the continuation pattern. Supposedly, in case the price is fixed above the pennant’s high of 12.19, a further uptrend is possible.
Double Bottom

The Double Bottom pattern has been formed on #NTDOY M5. Characteristics: the support level 10.58; the resistance level 10.62; the width of the pattern 4 points. If the resistance level is broken, a change in the trend can be predicted with the first target point lying at the distance of 4 points.
Bullish pennant
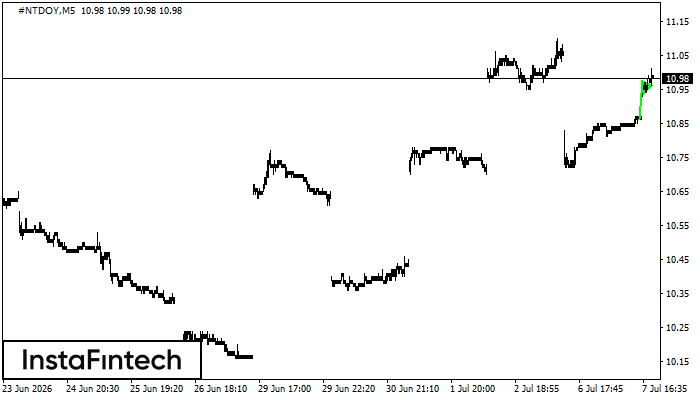
The Bullish pennant graphic pattern has formed on the #NTDOY M5 instrument. This pattern type falls under the category of continuation patterns. In this case, if the quote can breaks out high, is expected to continue the upward trend to level 11.13.
Triple Top
On the chart of the #NTDOY M15 trading instrument, the Triple Top pattern that signals a trend change has formed. It is possible that after formation of the third peak, the price will try to break through the resistance level 10.36, where we advise to open a trading position for sale. Take profit is the projection of the pattern’s width, which is 41 points.


