


FX.co ★ Actual patterns. Technical analysis and trading recommendations
实际图案

Bullish Rectangle

According to the chart of M5, #PEP formed the Bullish Rectangle which is a pattern of a trend continuation. The pattern is contained within the following borders: the lower border 143.95 – 143.95 and upper border 145.22 – 145.22. In case the upper border is broken, the instrument is likely to follow the upward trend.
Double Top

The Double Top reversal pattern has been formed on #PEP M30. Characteristics: the upper boundary 145.40; the lower boundary 141.77; the width of the pattern is 345 points. Sell trades are better to be opened below the lower boundary 141.77 with a possible movements towards the 141.47 level.
Double Top

The Double Top pattern has been formed on #PEP M15. It signals that the trend has been changed from upwards to downwards. Probably, if the base of the pattern 143.95 is broken, the downward movement will continue.
Double Top
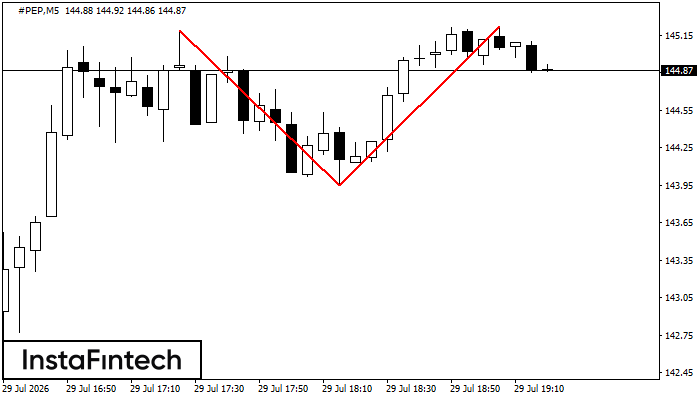
On the chart of #PEP M5 the Double Top reversal pattern has been formed. Characteristics: the upper boundary 145.22; the lower boundary 143.95; the width of the pattern 127 points. The signal: a break of the lower boundary will cause continuation of the downward trend targeting the 143.80 level.
Bullish pennant

The Bullish pennant pattern is formed on the #PEP M15 chart. It is a type of the continuation pattern. Supposedly, in case the price is fixed above the pennant’s high of 145.23, a further uptrend is possible.


