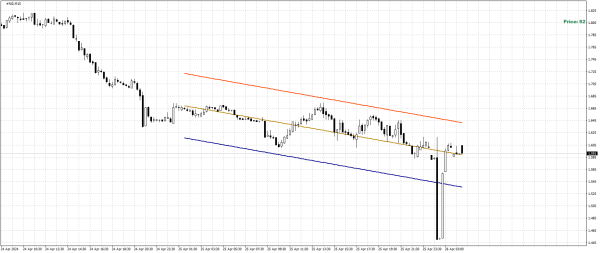
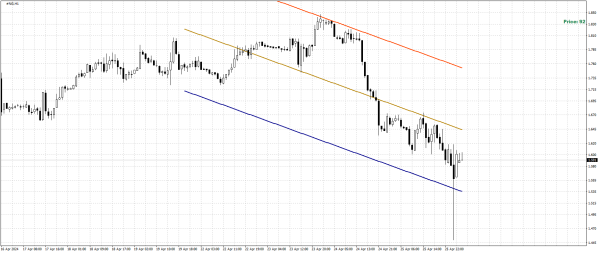
Good mood to everyone! The strength of the seller is expressed by the linear regression channel on the M15 chart, with its downward slope. The steeper the angle of inclination, the more activity is shown by the seller. Bears are making efforts to move down towards the target of 1.536. After the target is reached, a pullback to 1.641 is expected, which is needed to enter into selling positions. It is not advisable to sell at the bottom of the channel. Following the channel principle, we buy from the lower channel boundary and sell from the upper one. Currently, I am not very interested in buying, even though the channel is heading south, as it would mean going against the asset's movement. The relentless movement without stops at the level of 1.641 characterizes the determination of the seller who has decided to make a good downward run, indicating a significant potential for a decline. On the main H1 chart, which is crucial for me, I observe a descending channel. Just like on the M15 chart, there are no doubts about the bears' strength. Therefore, as mentioned earlier, I will be considering selling positions. Based on this timeframe, it is better to enter into sells from the upper channel boundary at 1.753. The decline will target the lower channel boundary at 1.535. Breaking above the level of 1.641 on the H1 channel will indicate a strong seller holding the market down, while staying above it shows signs of bullish activity. The rise will start to fade at the level of 1.753 with a subsequent resumption of the downward movement, indicating the presence of a strong player for downward movement, with whom I will be looking for selling opportunities.