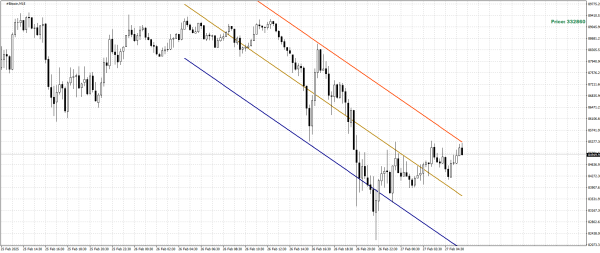
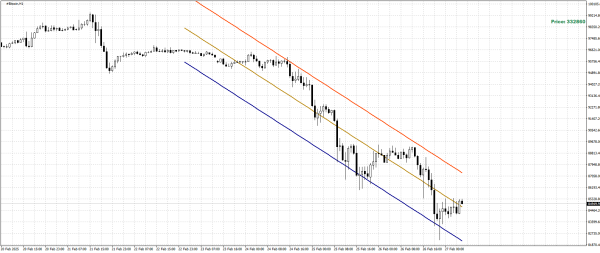
#Bitcoin Hello everyone! The seller is showing activity, as indicated by the downward sloping linear regression channel. The instrument is trading below the level of 85362.25. I am considering selling towards the level of 81913.13, from which a correction can be expected. Therefore, I stop considering shorts at lower levels. I am waiting for a pullback to think further about sales. Sales from the level of 85362.25 are more attractive, as breaking out beyond it threatens bullish interest. Therefore, selling from 85362.25 puts me in between buying and selling. It is clear to see the reaction of the two players, which can help adjust trading, reducing losses with the possibility of quick profit in day trading. Considering the situation on the hourly chart, I also observe a downward sloping linear regression channel. Both channels are moving in the same direction, indicating the absence of strong buyers. The probability of a trend reversal based on the H1 channel in this case is very low. Therefore, selling is much more interesting for me than buying against the movement of the two channels signaling sales. The bullish obstacle is the level of 85362.25, breaking through which could lead to an increase towards the upper channel boundary of 87318.69. I will sell from there aiming to reach the targets of 81913.13 and 82159.69. Achieving the targets will depend on channel volatility, which will contribute to a bullish pullback. A rise on the pullback is not very interesting to me; working with the trend is the priority direction.


