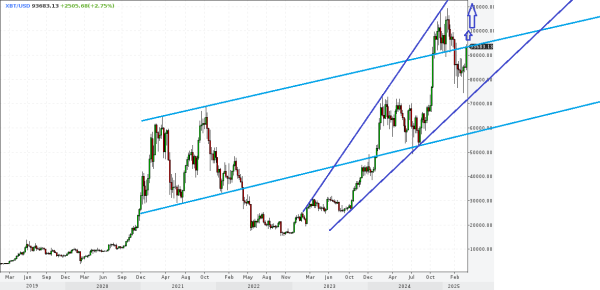

BITCOIN Good day, forum colleagues and fellow traders! Since the time of my last analytical forecast, the price has not moved far in either direction, so it is possible to publish the previous forecast charts, as we are talking about higher timeframes - the weekly and daily charts, the forecasts on which are still relevant. Let's start with the weekly timeframe. We open the weekly chart and see that a broad ascending price channel was previously formed, within which Bitcoin is trading at the level of 93600. Currently, the price has reached its upper boundary and is trying to break through and establish itself above it. In case of a confident breakthrough and consolidation above the resistance line, Bitcoin may shoot to the north, with the target for buyers being a rise to the level of 110000. It is worth noting that an ascending price channel has already been formed on the weekly chart. Weekly chart: Within the second ascending price channel, the formation of the third wave of growth is currently taking place. On the daily chart, we also have a strong signal for further purchases. We open the D1 chart and see that the price has broken through the inclined line under which the leading cryptocurrency has been moving in a southern direction for quite a long time. The breakthrough was drawn at the level of 84000, after which Bitcoin shot to the north and reached the level of 95000, where a new local maximum was formed. A bounce was received from the high, and currently Bitcoin is trading at 93600, and despite the pullback, I expect a continuation of the upward trend in the medium-term trading perspective. Daily chart:


