


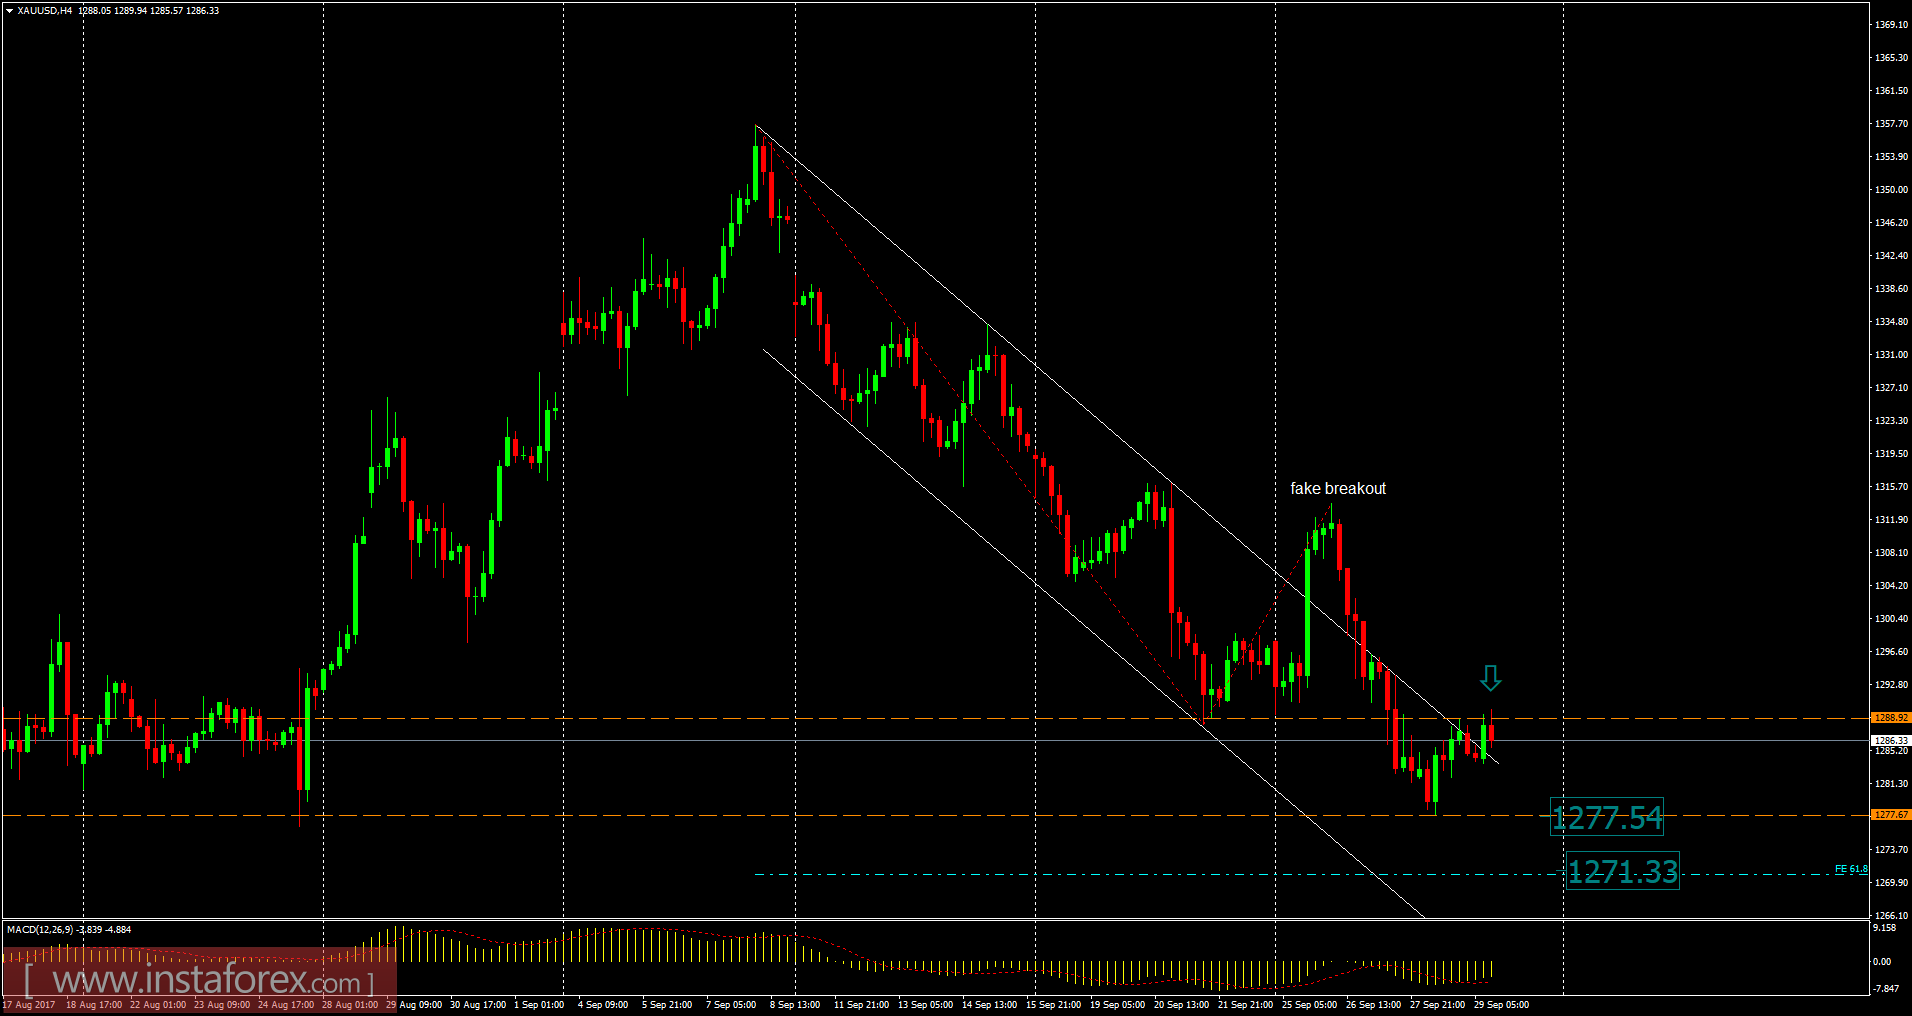
Recently, Gold has been trading sideways at the price of $1,286.50. According to the 4H time frame, I found testing of resistance at the price of $1,289.00 (last week low), which is a sign that buying looks risky. There is a fake breakout of downward channel in the background, which is another sign of weakness. My advice is to watch for potential selling opportunities. The downward targets are set at the price of $1,277.55 and $1,271.35.
Resistance levels:
R1: $1,293.45
R2: $1,295.75
R3: $1,299.00
Support levels:
S1: $1,287.85
S2: $1,284.50
S3: $1,282.15
Trading recommendations for today: watch for potential selling opportunities.


