


USDX is in a corrective phase in the short-term and awaits to test the 200 SMA at H1 chart. Further gains are expected to take place during this week, as the price action doesn't give any hints of bearish continuation. However, if it manages to consolidate below the 200 SMA at H1 chart, we can expect a decline towards the support level of 91.67.
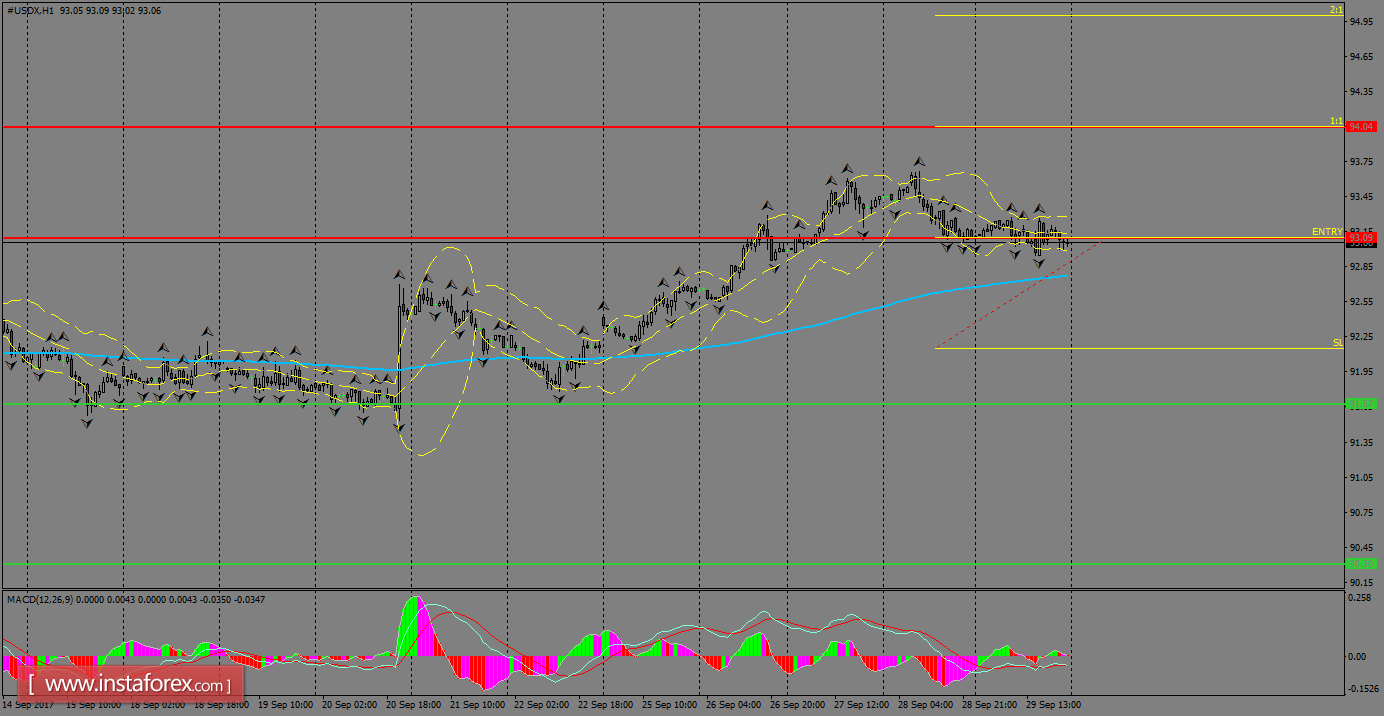
H1 chart's resistance levels: 93.09 / 94.04
H1 chart's support levels: 91.67 / 90.30
Trading recommendations for today: Based on the H1 chart, place bull (long) orders only if the USD Index breaks with a bullish candlestick; the resistance level is at 93.09, take profit is at 94.04 and stop loss is at 92.15.


