


The USDX managed to retrace during Tuesday's session and it can test the 200 SMA on the H1 chart, which is approaching the current price. If the index does a breakout above 94.04, it is expected to test the resistance level of 94.58. Overall, the index shows a price action in favor of the bulls. The MACD indicator is in the negative territory, favoring an extension of the decline.
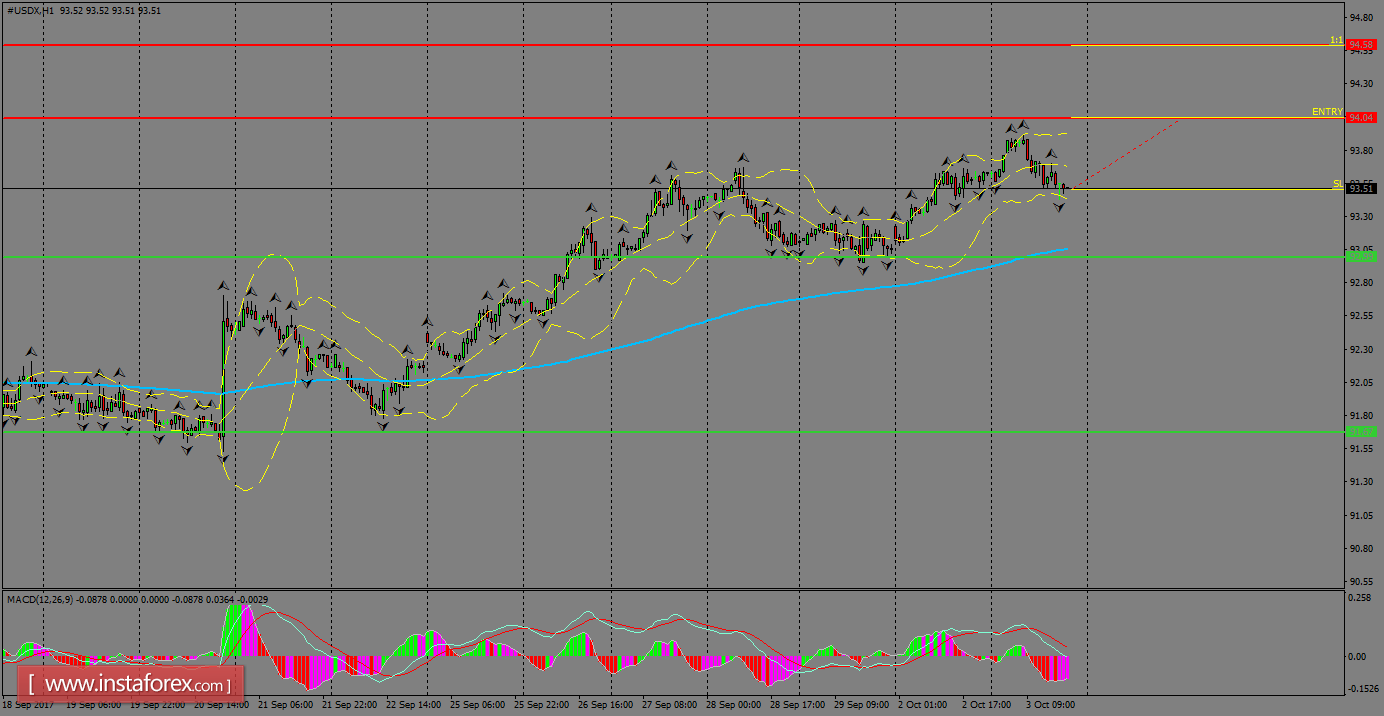
H1 chart's resistance levels: 94.04 / 94.58
H1 chart's support levels: 93.00 / 91.67
Trading recommendations for today: Based on the H1 chart, place buy (long) orders only if the USD Index breaks with a bullish candlestick; the resistance level is at 94.04, take profit is at 94.58 and stop loss is at 93.50.


