Main Quotes Calendar Forum
flag

FX.co ★ Technical analysis of gold for October 04, 2017

parent
Forex Analysis:::2017-10-04T07:04:03

Technical analysis of gold for October 04, 2017

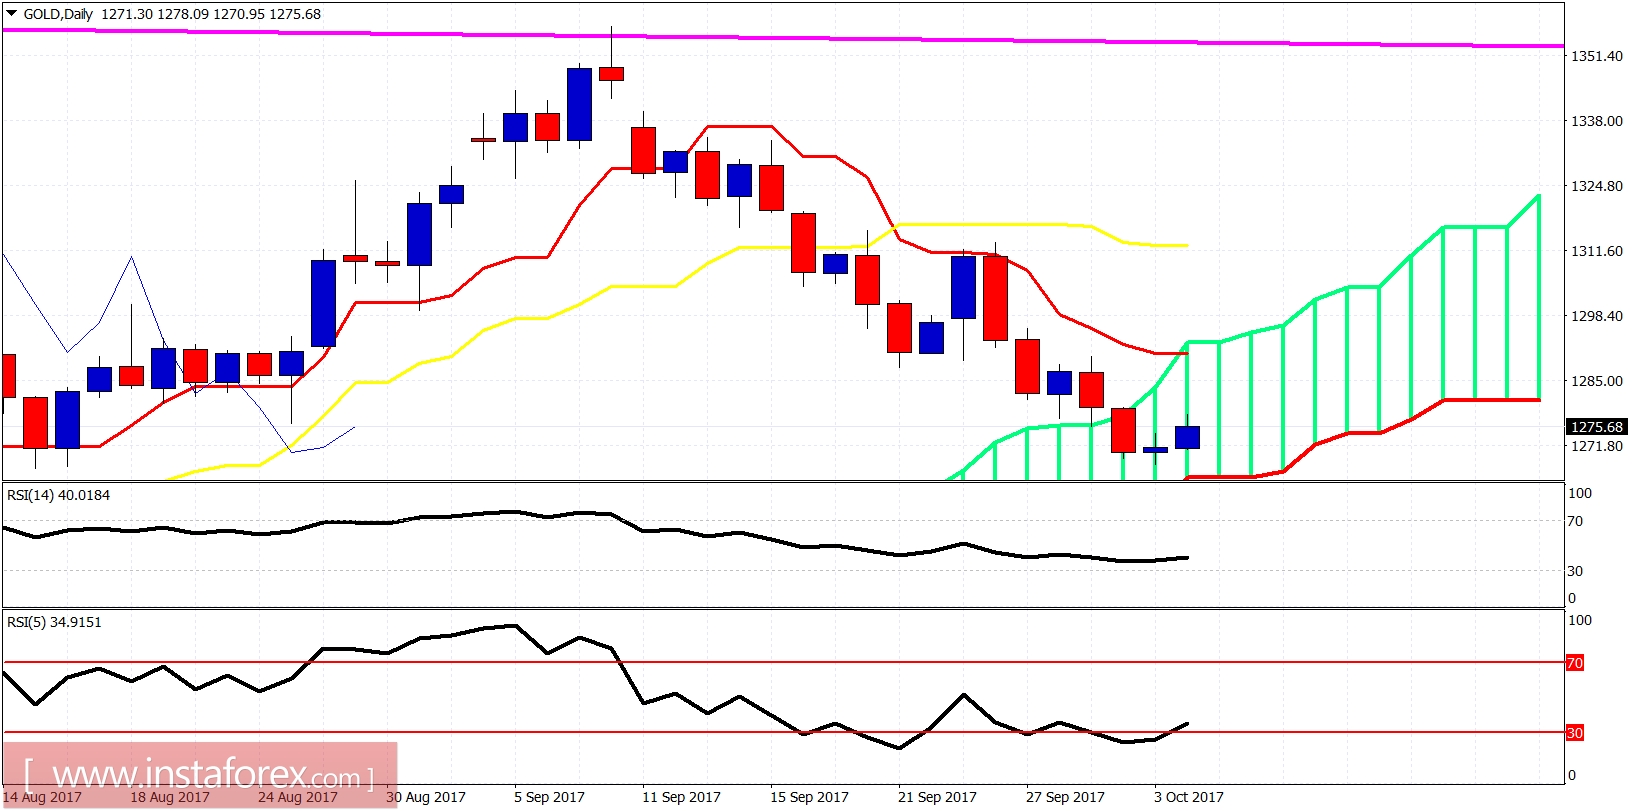
Gold price has broken out of the downward sloping triangle pattern. Both RSI indicators have suggested that a bounce was imminent. Minimum target for the bounce is the $1,295 area.

Technical analysis of gold for October 04, 2017

Black line - resistance

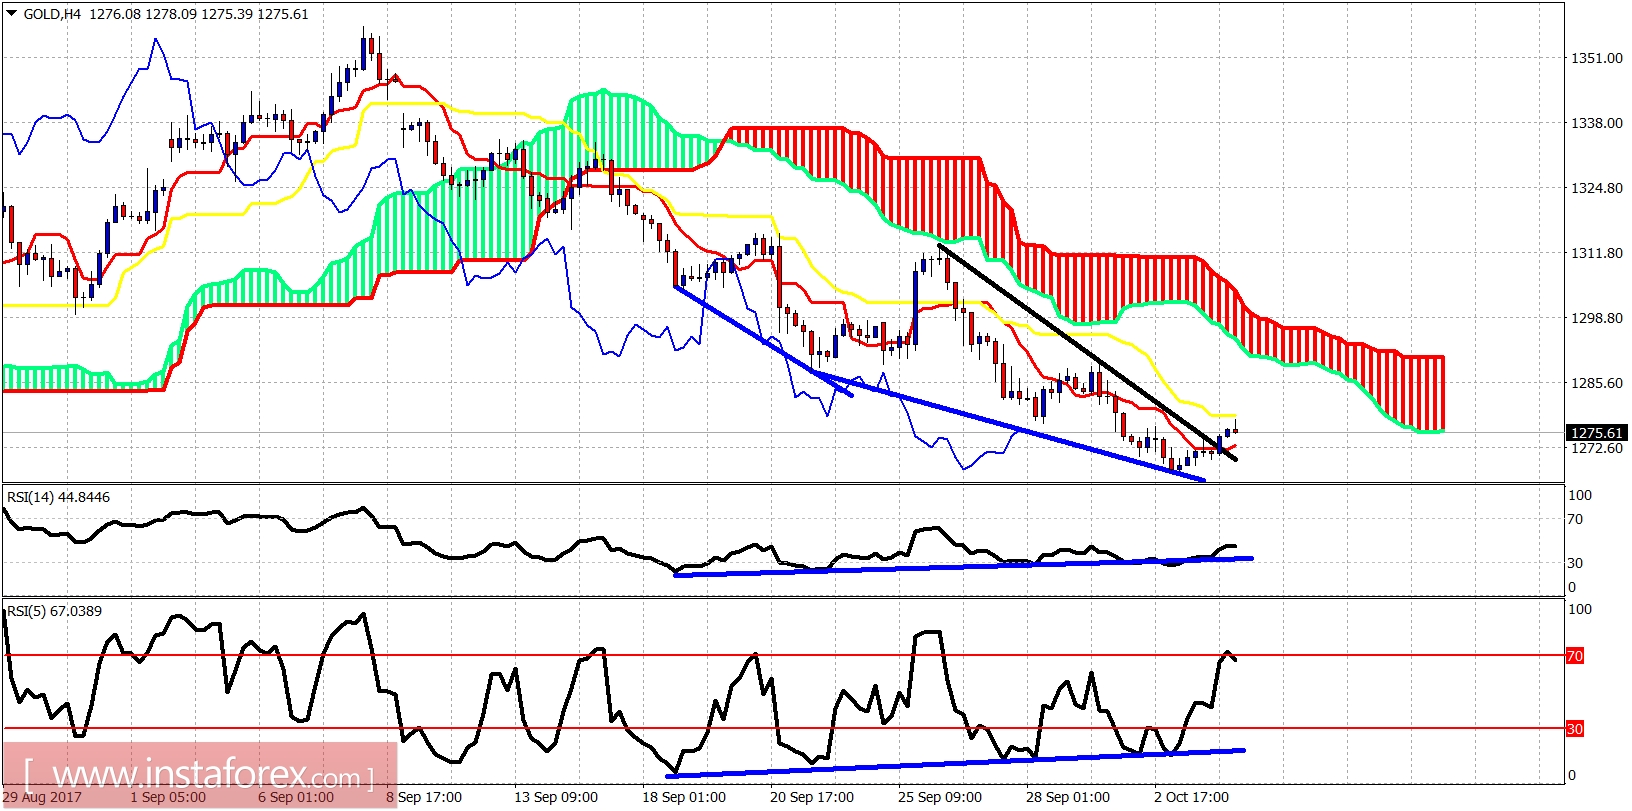
Blue lines - bullish divergence signs

Gold price has broken above the triangle pattern and is bouncing towards the Ichimoku cloud resistance of $1,288. Support is at $1,268 now and if broken we should expect a move towards $1,260-50. Trend remains bearish as long as price is below $1,316.

Technical analysis of gold for October 04, 2017

On a daily basis we have the first signs of a possible 20$ bounce towards $1,298. There are bullish divergence signs in the RSI and I do not expect to see Gold price trading near the lows for much longer. The $1,300 level is expected to be tested again.
Analyst InstaForex
Share this article:
parent
loader...
all-was_read__icon
You have watched all the best publications
presently.
We are already looking for something interesting for you...
all-was_read__star
Recently published:
loader...
More recent publications...