Main Quotes Calendar Forum
flag

FX.co ★ Technical analysis of gold for October 05, 2017

parent
Forex Analysis:::2017-10-05T06:47:22

Technical analysis of gold for October 05, 2017

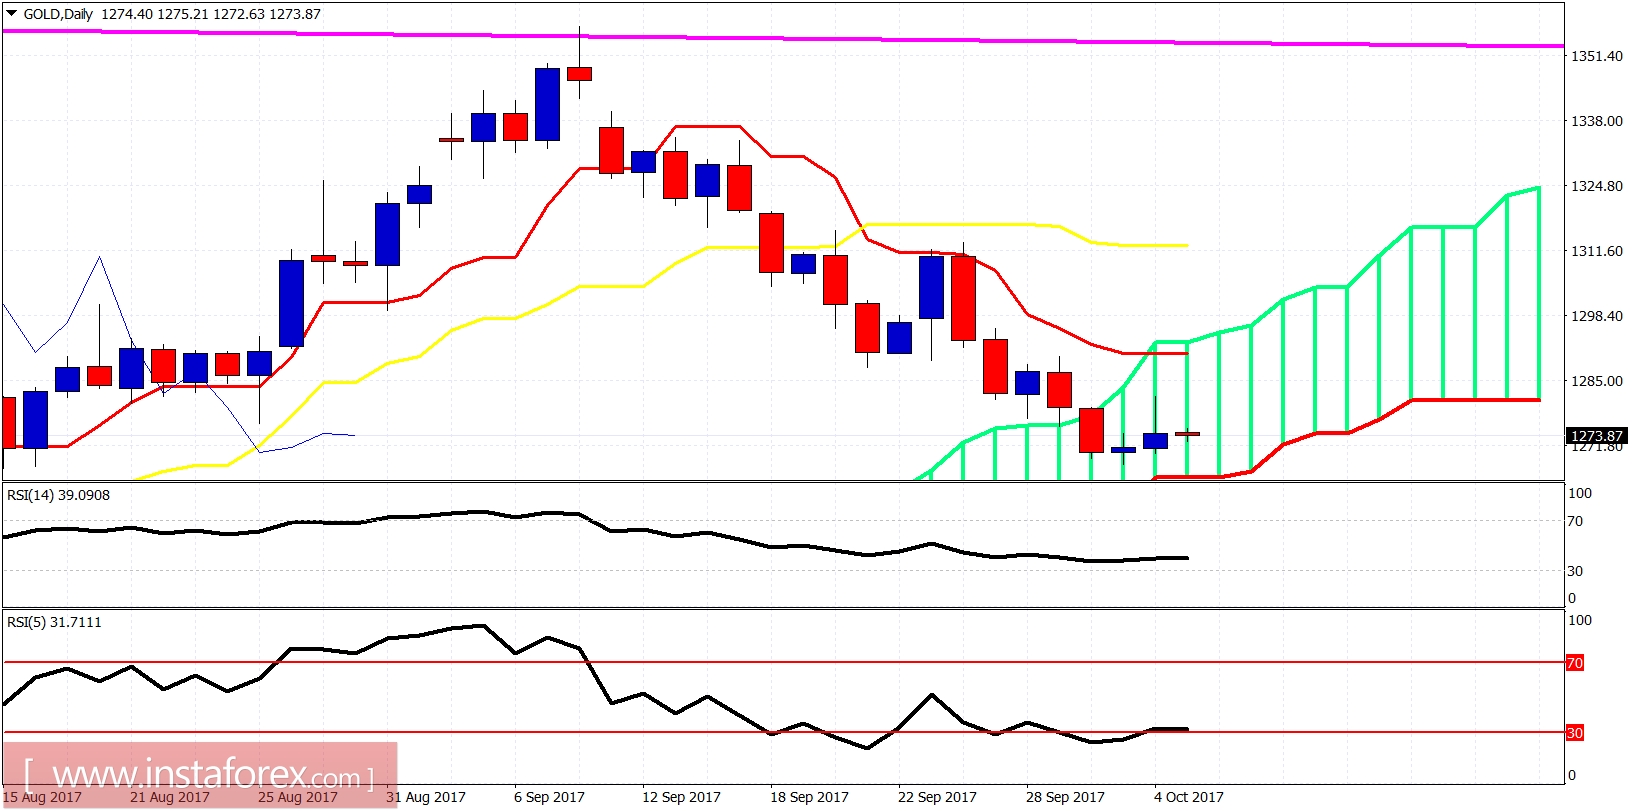
Gold price broke out of the downward sloping triangle pattern as we expected given the signs from the bullish divergence in the RSI. However the bounce was not as strong as we expected, mainly because of the strength in the Dollar and mainly in the USDJPY.

Technical analysis of gold for October 05, 2017

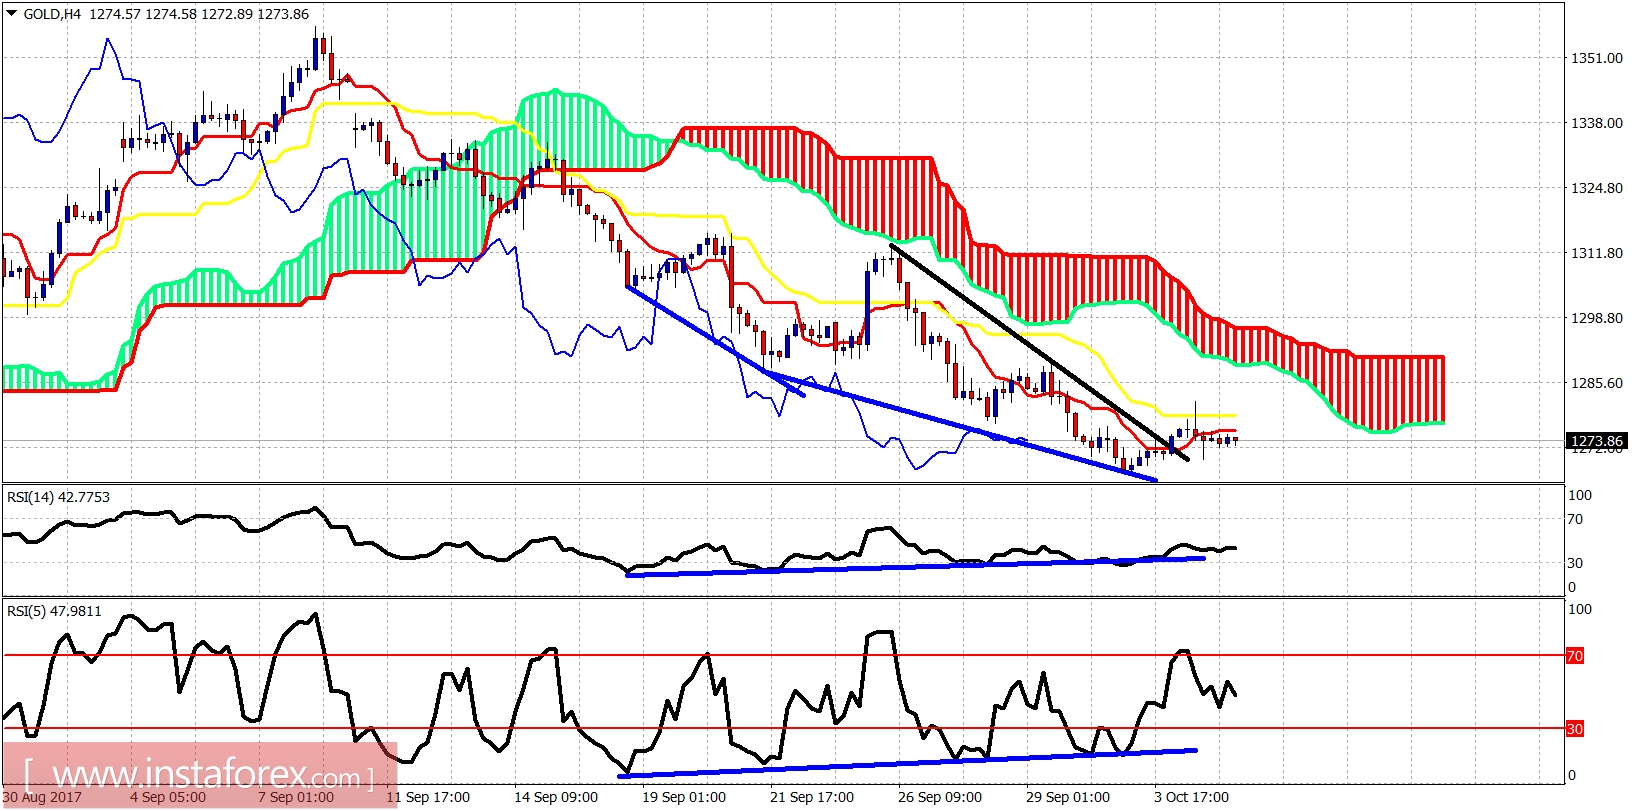
Black line - resistance (broken)

Gold price is trading above the black resistance trend line but below the Kumo (cloud). Price remains in a bearish trend as we have not seen a sequence of higher highs and higher lows yet and the previous high at $1,290 remains intact. This is the most important short-term resistance now. Breaking above could push Gold towards $1,300 and higher. Support is at $1,268.

Technical analysis of gold for October 05, 2017

Breaking below support will open the way for a push lower towards $1,260-50. On a daily basis as shown above, the RSI is diverging and our longer-term view remains bullish and we still consider this pullback as a buying opportunity for the next move above $1,400.
Analyst InstaForex
Share this article:
parent
loader...
all-was_read__icon
You have watched all the best publications
presently.
We are already looking for something interesting for you...
all-was_read__star
Recently published:
loader...
More recent publications...