Main Quotes Calendar Forum
flag

FX.co ★ Technical analysis of gold for October 09, 2017

parent
Forex Analysis:::2017-10-09T07:00:00

Technical analysis of gold for October 09, 2017

Gold price is trading higher after the reversal on Friday. We have been warning Gold bears that the bullish divergence signs combined with the important support of 61.8% Fibo at $1,260 justified a strong bounce. However we do not see this as just a bounce but the start of a bigger move higher.

Technical analysis of gold for October 09, 2017

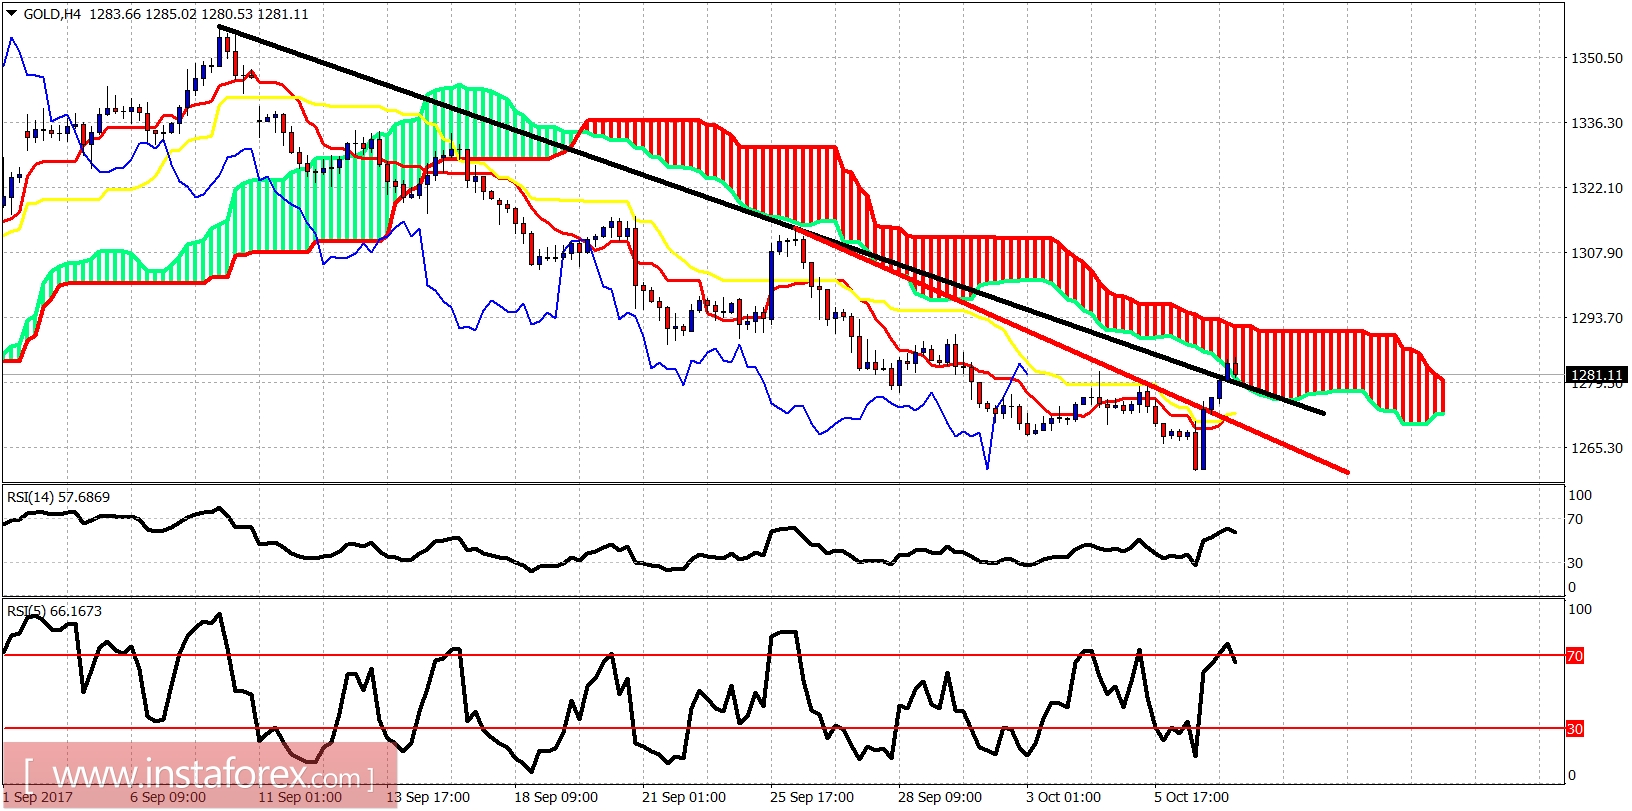
Black line - resistance (broken)

Red line - resistance (broken)

Gold price has made an important low at $1,260. I believe we have started the next leg up towards $1,400. I'm very bullish Gold. Short-term support is now at $1,272. Resistance is at $1,293 and next at $1,316. Breaking above these levels will open up the way towards $1,350-75.

Technical analysis of gold for October 09, 2017

Long lower tail in the weekly candle of Gold price bouncing off the 61.8% Fibonacci retracement of the rise from $1,205 to $1,356. This candlestick formation is considered a bullish reversal signal specially if this week's candle is also bullish.
Analyst InstaForex
Share this article:
parent
loader...
all-was_read__icon
You have watched all the best publications
presently.
We are already looking for something interesting for you...
all-was_read__star
Recently published:
loader...
More recent publications...