


USDX continues to be in a corrective move that points to test the 200 SMA, according to the H1 chart. Around that area we can expect a rebound to take place towards the resistance level of 94.04, at which a breakout should open the doors to reach the 94.58 level in a first degree. MACD indicator still remains flat and new positions at this stage are not advisable.
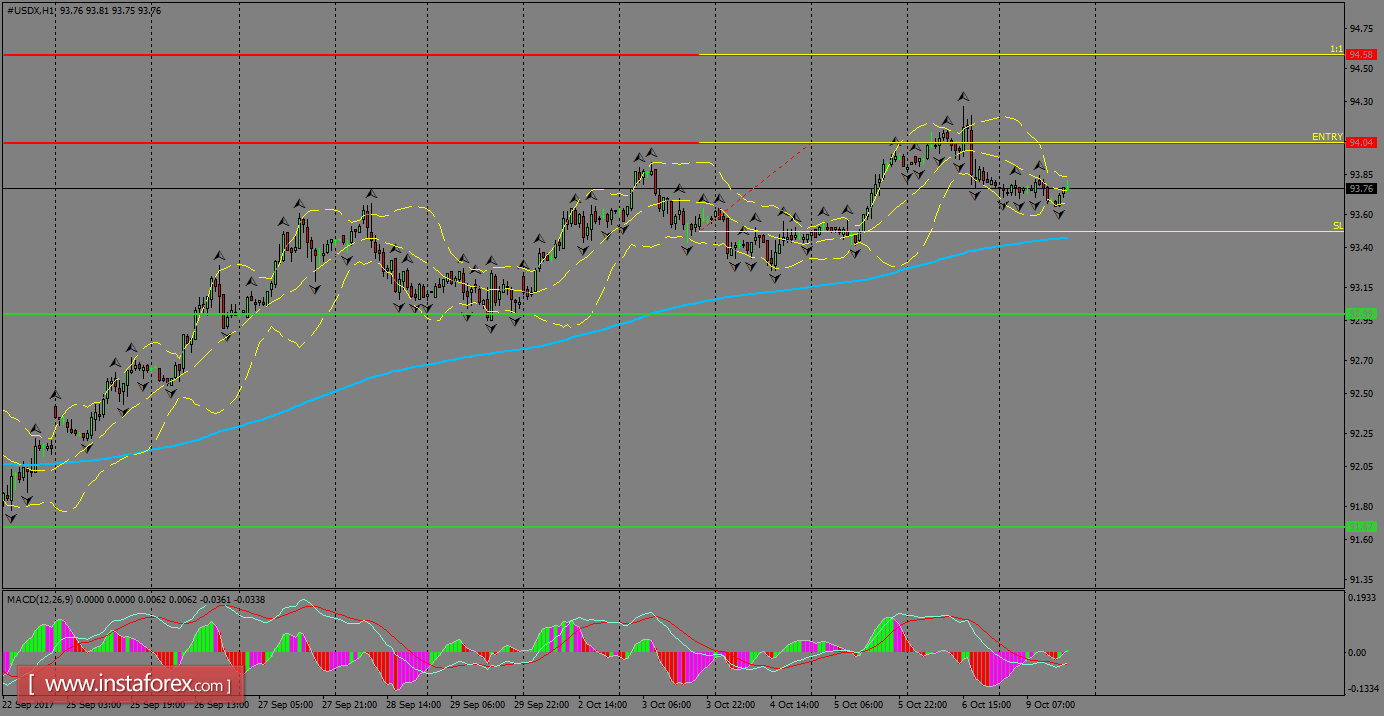
H1 chart's resistance levels: 94.04 / 94.58
H1 chart's support levels: 93.00 / 91.67
Trading recommendations for today: Based on the H1 chart, place buy (long) orders only if the USD Index breaks with a bullish candlestick; the resistance level is at 94.04, take profit is at 94.58 and stop loss is at 93.50.


