Main Quotes Calendar Forum
flag

FX.co ★ Ichimoku indicator analysis of gold for October 11, 2017

parent
Forex Analysis:::2017-10-11T06:55:50

Ichimoku indicator analysis of gold for October 11, 2017

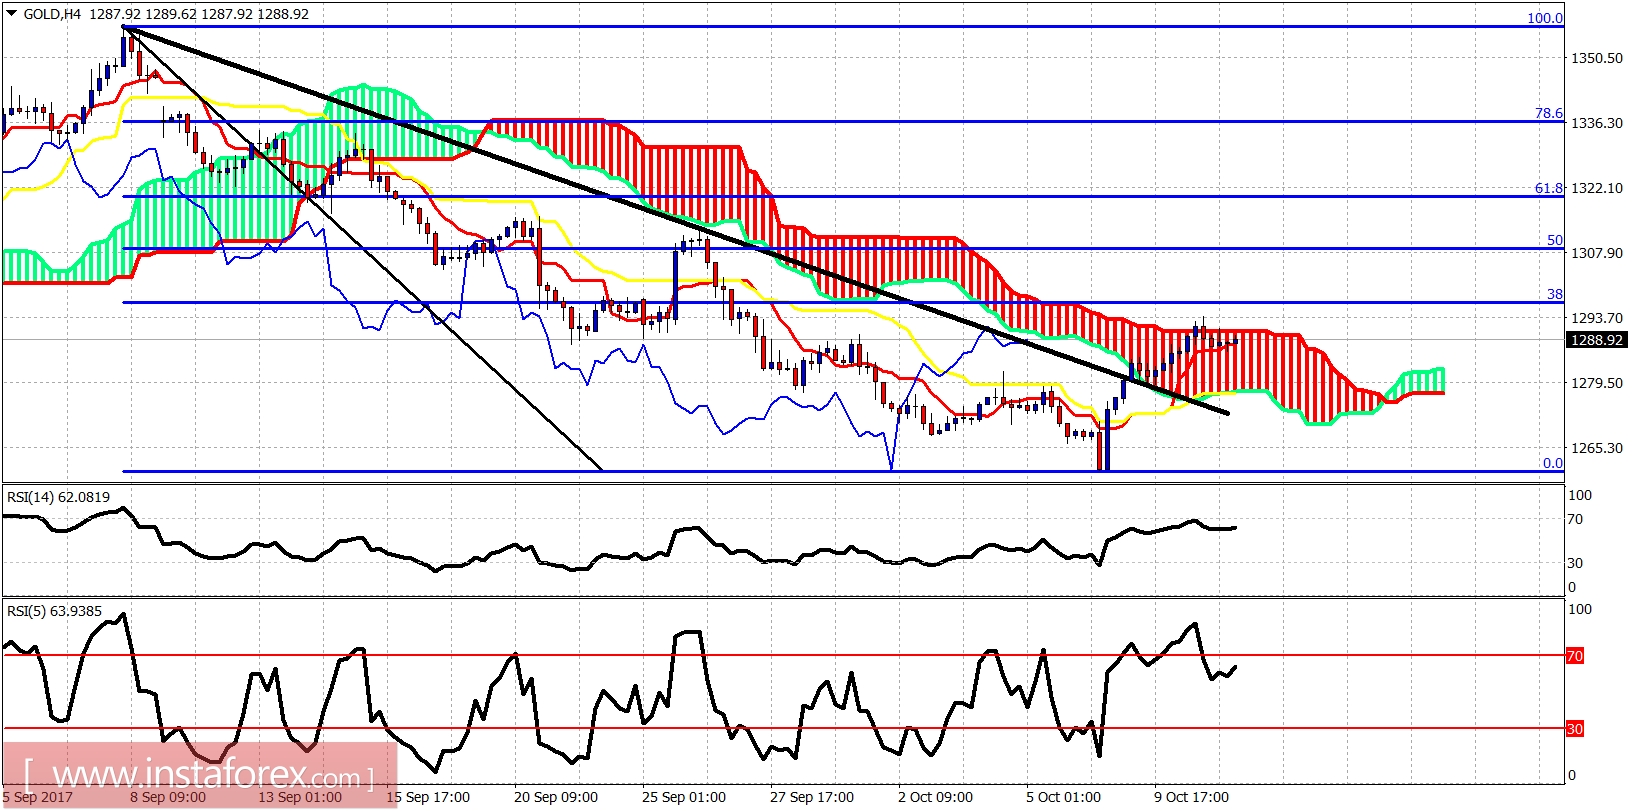
The Gold price is testing the upper boundaries of the 4-hour Kumo (Ichimoku cloud). The price has broken above the short-term downward sloping trend line resistance levels and has most probably started its next upward move towards $1,400.

Ichimoku indicator analysis of gold for October 11, 2017

The Gold price is trading above both the tenkan- and kijun-sen in the 4-hour chart. This is the first bullish sign. Gold price is inside the 4-hour Kumo trying to break above it. The 38% Fibonacci retracement resistance is found at $1,297. Gold bulls will need to break above $1,295-$1,300 in order for the short-term trend to change to bullish again.

Ichimoku indicator analysis of gold for October 11, 2017

On a daily basis, the price is inside the Kumo but has broken above the tenkan-sen (Redline indicator). Next resistance level is at $1,310. A daily close above it will confirm bullish daily trend confirmation. Gold price is expected to continue higher over the coming weeks as we considered this pullback as a buying opportunity.
Analyst InstaForex
Share this article:
parent
loader...
all-was_read__icon
You have watched all the best publications
presently.
We are already looking for something interesting for you...
all-was_read__star
Recently published:
loader...
More recent publications...