


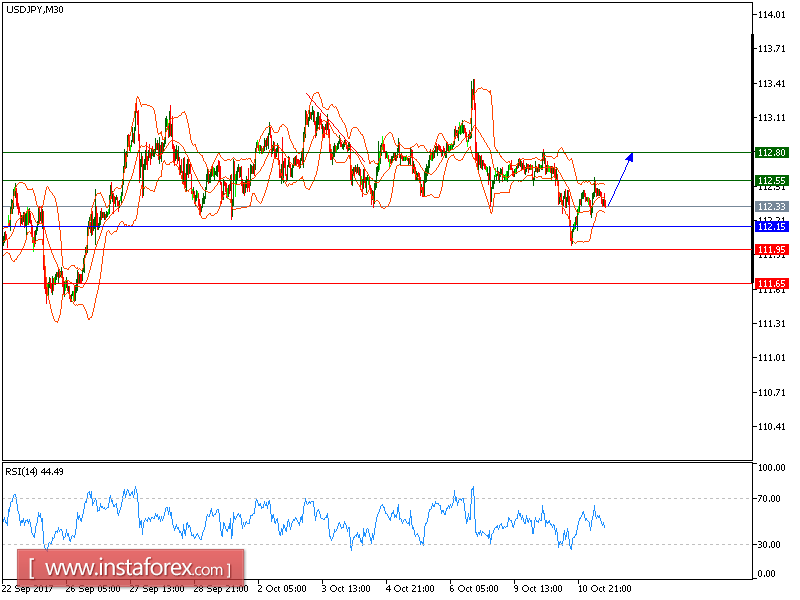
USD/JPY is expected to trade with a bullish outlook. Although the pair made a pullback, it is still trading above its rising 50-period moving average. The relative strength index is above its neutrality level at 50 and lacks downward momentum.
Therefore, as long as 112.15 is support, a further upside to 112.55 and even to 112.80 seems more likely to occur.
Alternatively, if the price moves in the opposite direction, a short position is recommended below 112.15 with a target at 111.95.
Chart Explanation: The black line shows the pivot point. The current price above the pivot point indicates a bullish position, while the price below the pivot point is a signal for a short position. The red lines show the support levels and the green line indicates the resistance level. These levels can be used to enter and exit trades.
Strategy: BUY, Stop Loss: 112.15, Take Profit: 112.55
Resistance levels: 112.55, 112.80 and 113.15 Support Levels: 111.95, 111.65, 111.35


