


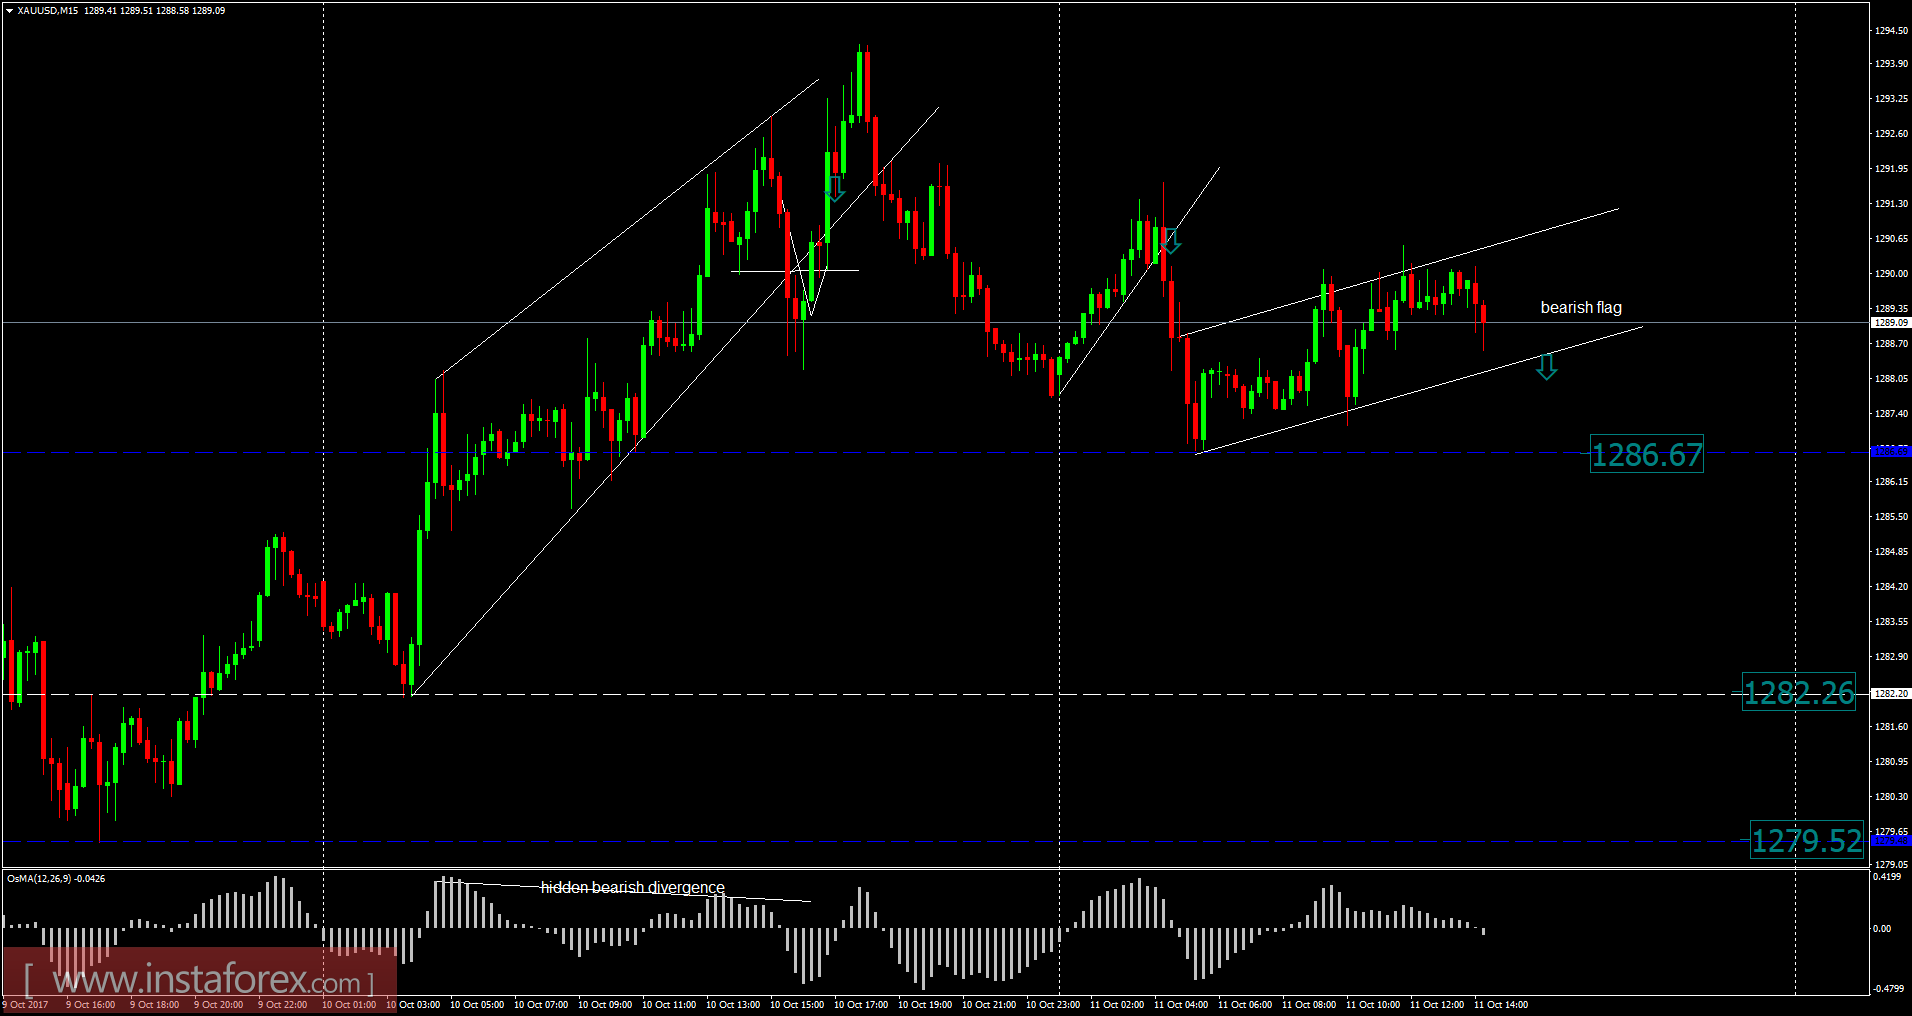
Recently, Gold has been trading sideways at the price of $1,289.00. According to the 15M time - frame, I found that price has broken the upward channel in the background, which is a sign that buying looks risky. I also found a bearish flag (bearish pattern) in creation, which is another sign of weakness. My advice is to watch for potential selling opportunities. Downward targets are set at the price of $1,286.70, $1,282.30 and $1,279.50.
Resistance levels:
R1: $1,293.25
R2: $1,294.75
R3: $1,296.60
Support levels:
S1: $1,289.90
S2: $1,288.00
S3: $1,286.50
Trading recommendations for today: watch for potential selling opportunities.


