Gold price has broken above the Ichimoku cloud in the short term but has also reached important Fibonacci resistance now. As long as price is above $1,260, bulls will be in control of the trend. A pullback with a higher low is justified and would give more strength to the upside momentum.
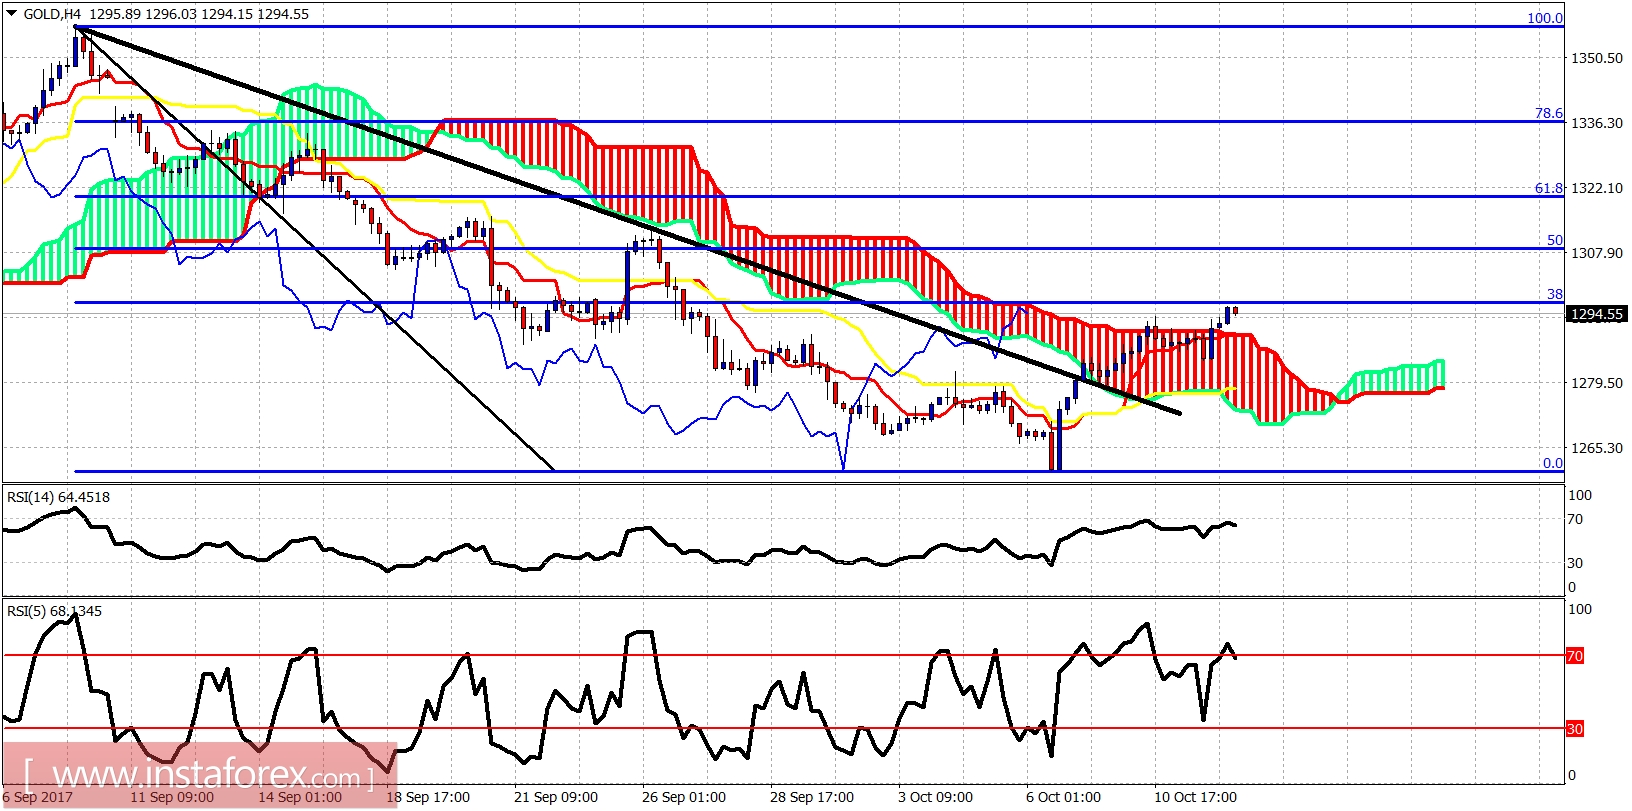
In the 4-hour chart, price is above the Kumo. This is a bullish sign. Price has reached the 38% Fibonacci retracement. There are some slight bearish divergence signs in the 4-hour chart by the RSI and this could justify a pullback towards the upper cloud boundary near $1,290-87.
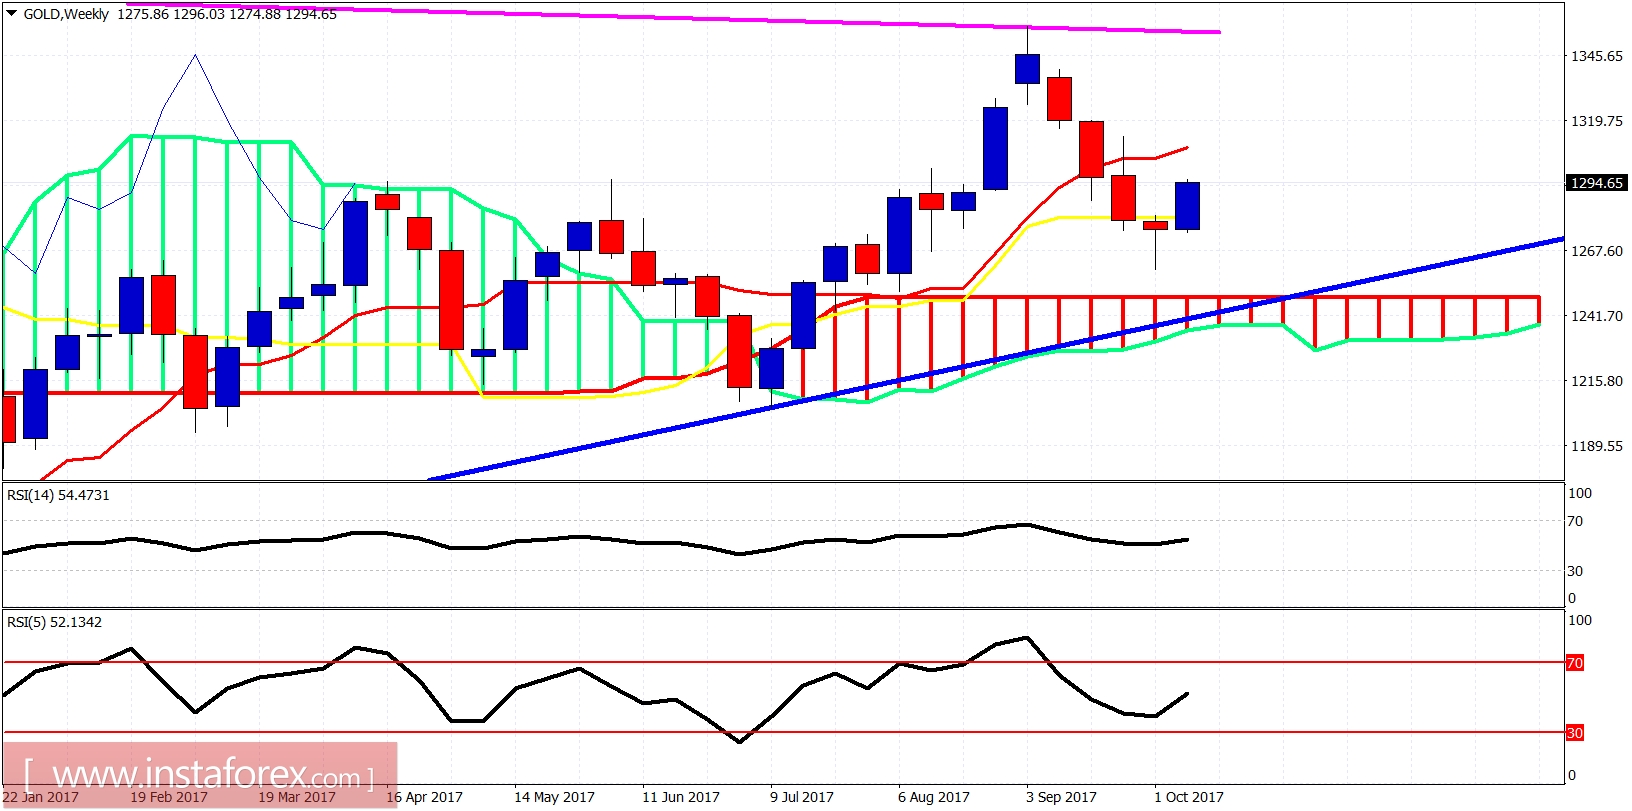
On a weekly basis, it is positive we are trading above the kijun-sen and the RSI (5) is turning back upwards. Price remains above the Ichimoku cloud and last week's reversal candle pattern is being confirmed this week. So we should expect a weekly move higher maybe to new highs.


