Main Quotes Calendar Forum
flag

FX.co ★ Ichimoku indicator analysis of gold for October 13, 2017

parent
Forex Analysis:::2017-10-13T06:50:10

Ichimoku indicator analysis of gold for October 13, 2017

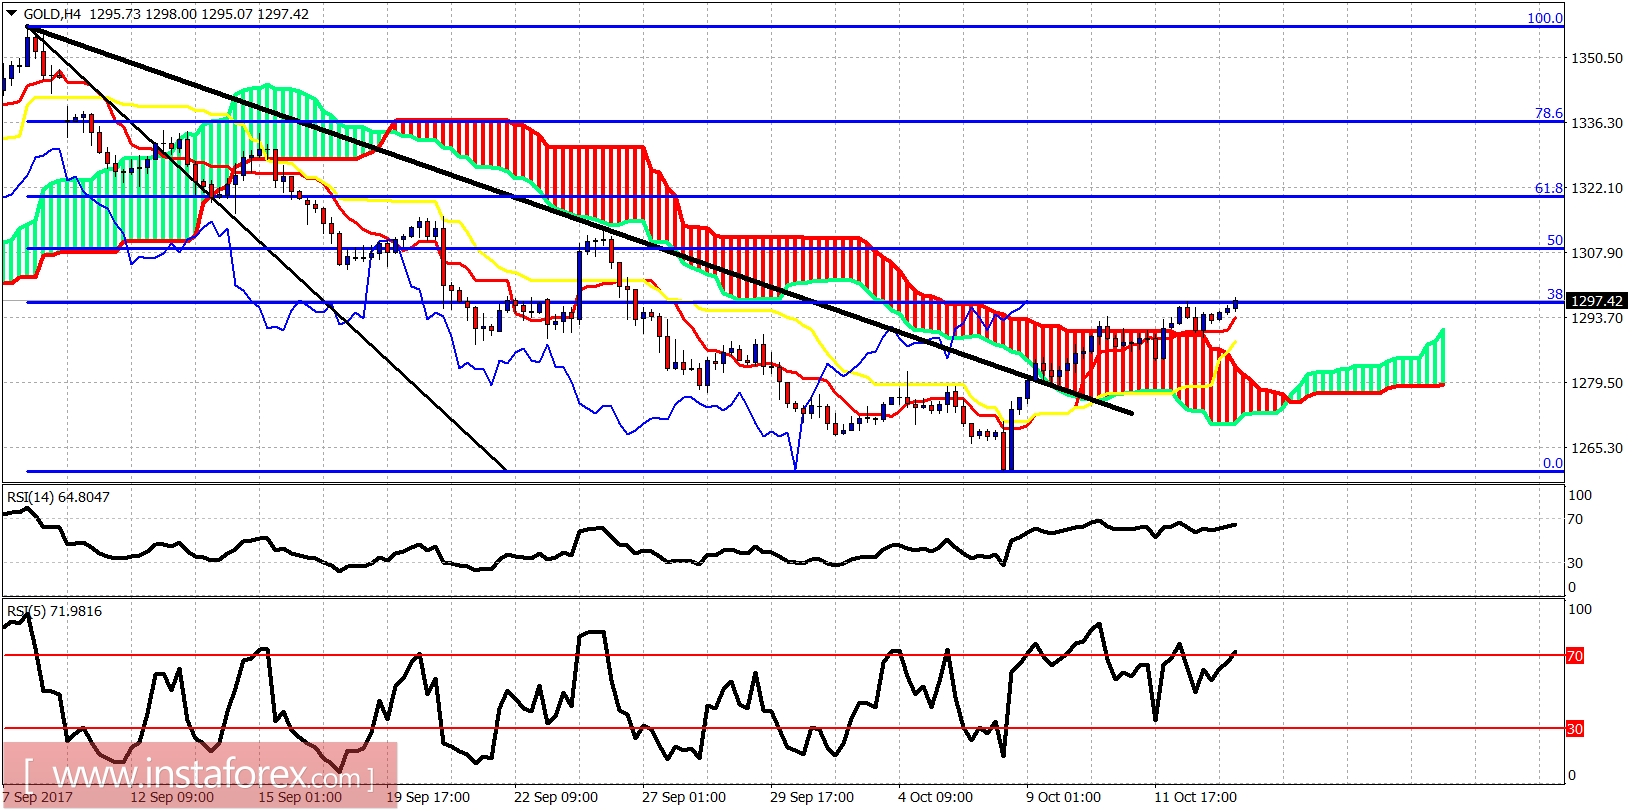
Gold price made a shallow pull back yesterday towards $1,289 and is now making fresh new highs. Gold price is breaking above the 38% Fibonacci retracement and this is a bullish continuation sign.

Ichimoku indicator analysis of gold for October 13, 2017

The short-term RSI is overbought and diverging. This is just a small warning that we could see another short-term pull back towards $1,290 before higher, but necessary. Gold is in a bullish short-term trend after breaking above the 4-hour Kumo (cloud). Support is at $1,288 and next at $1,283.

Ichimoku indicator analysis of gold for October 13, 2017

The weekly reversal off the kijun-sen (yellow line indicator) is progressing as expected and according to bulls plan. Trend remains bullish and with short-term trend changing to bullish again, we expect Gold price to move at least towards $1,320. The big test will come then.
Analyst InstaForex
Share this article:
parent
loader...
all-was_read__icon
You have watched all the best publications
presently.
We are already looking for something interesting for you...
all-was_read__star
Recently published:
loader...
More recent publications...