


The pair has been consolidating gains above the 200 SMA, but now it's finding resistance around 1.3309. With a break above that area, we can expect further gains towards the 1.3373 level. To the downside, nearest support lies at 1.3216 ahead of the 1.3037 level. MACD indicator remains in the negative territory, favoring to the bears.
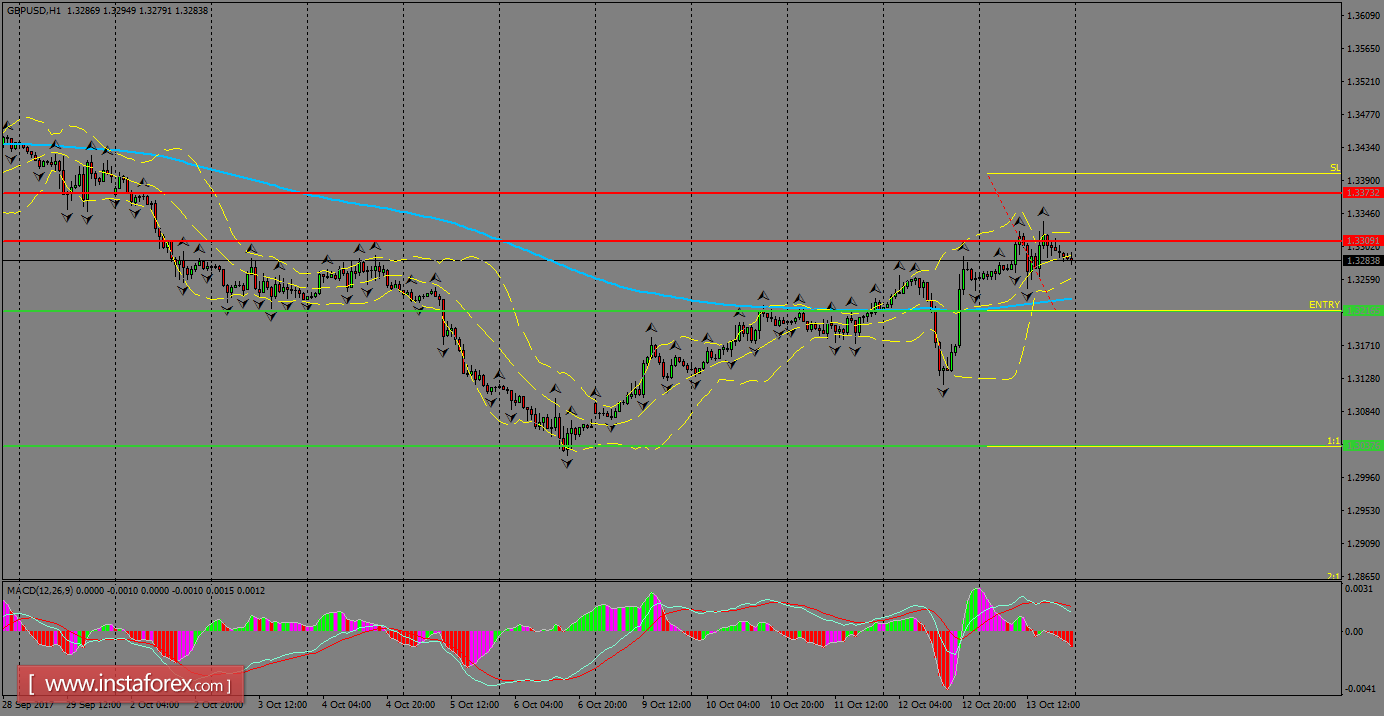
H1 chart's resistance levels: 1.3309 / 1.3373
H1 chart's support levels: 1.3216 / 1.3037
Trading recommendations for today: Based on the H1 chart, sell (short) orders only if the GBP/USD pair breaks a bearish candlestick; the support level is at 1.3216, take profit is at 1.3037 and stop loss is at 1.3398.


