Main Quotes Calendar Forum
flag

FX.co ★ Ichimoku indicator analysis of gold for October 17, 2017

parent
Forex Analysis:::2017-10-17T07:01:16

Ichimoku indicator analysis of gold for October 17, 2017

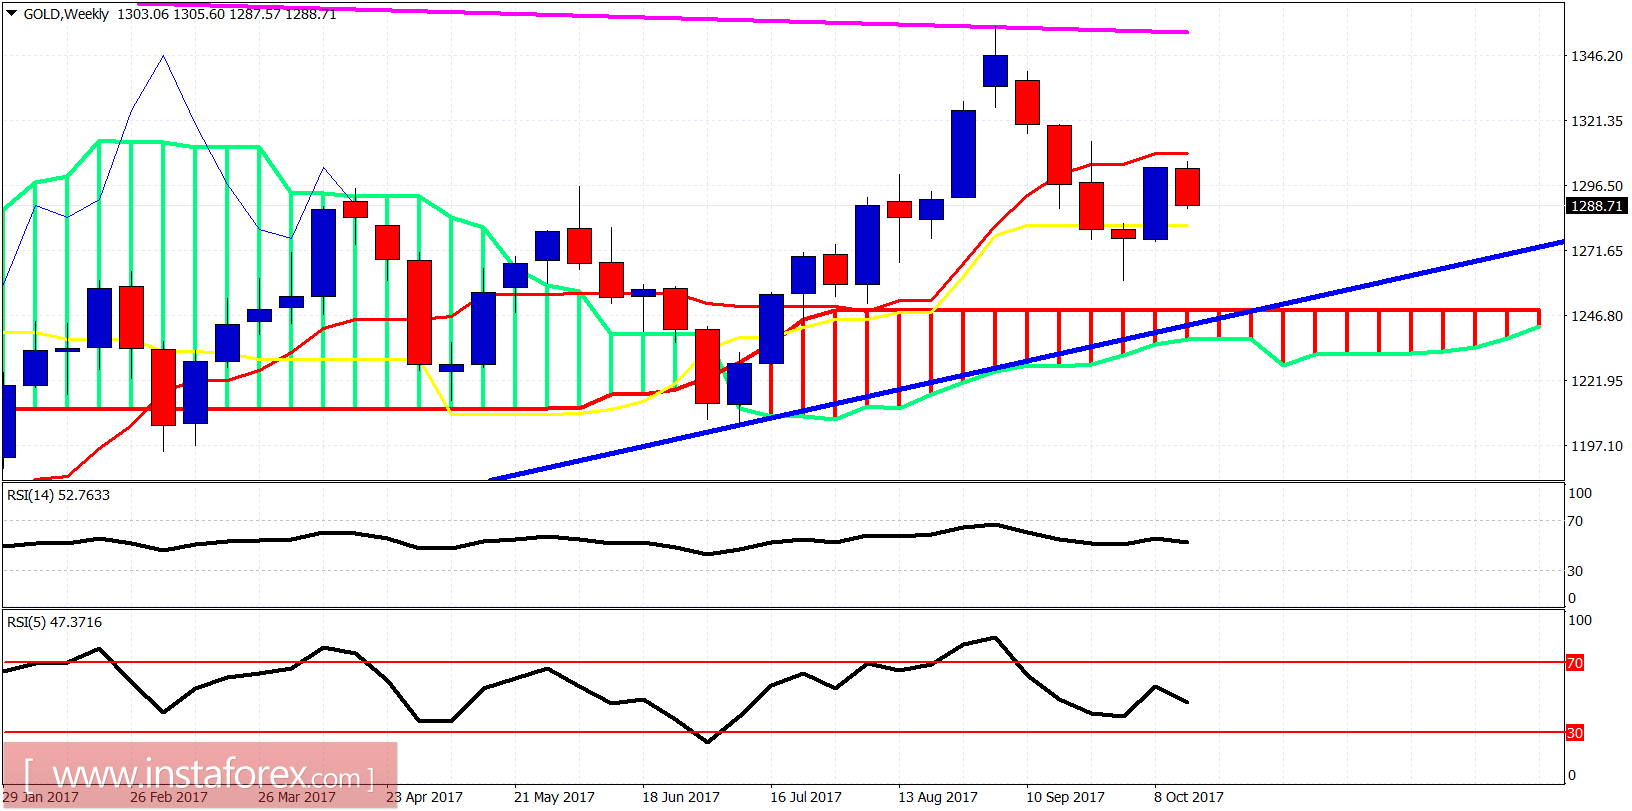
Gold price reversed yesterday and has pulled back below $1,300. As we mentioned a couple days ago, the area of $1,305-$1,310 is an important resistance area and a pullback from that area towards $1,280 was justified.

Ichimoku indicator analysis of gold for October 17, 2017

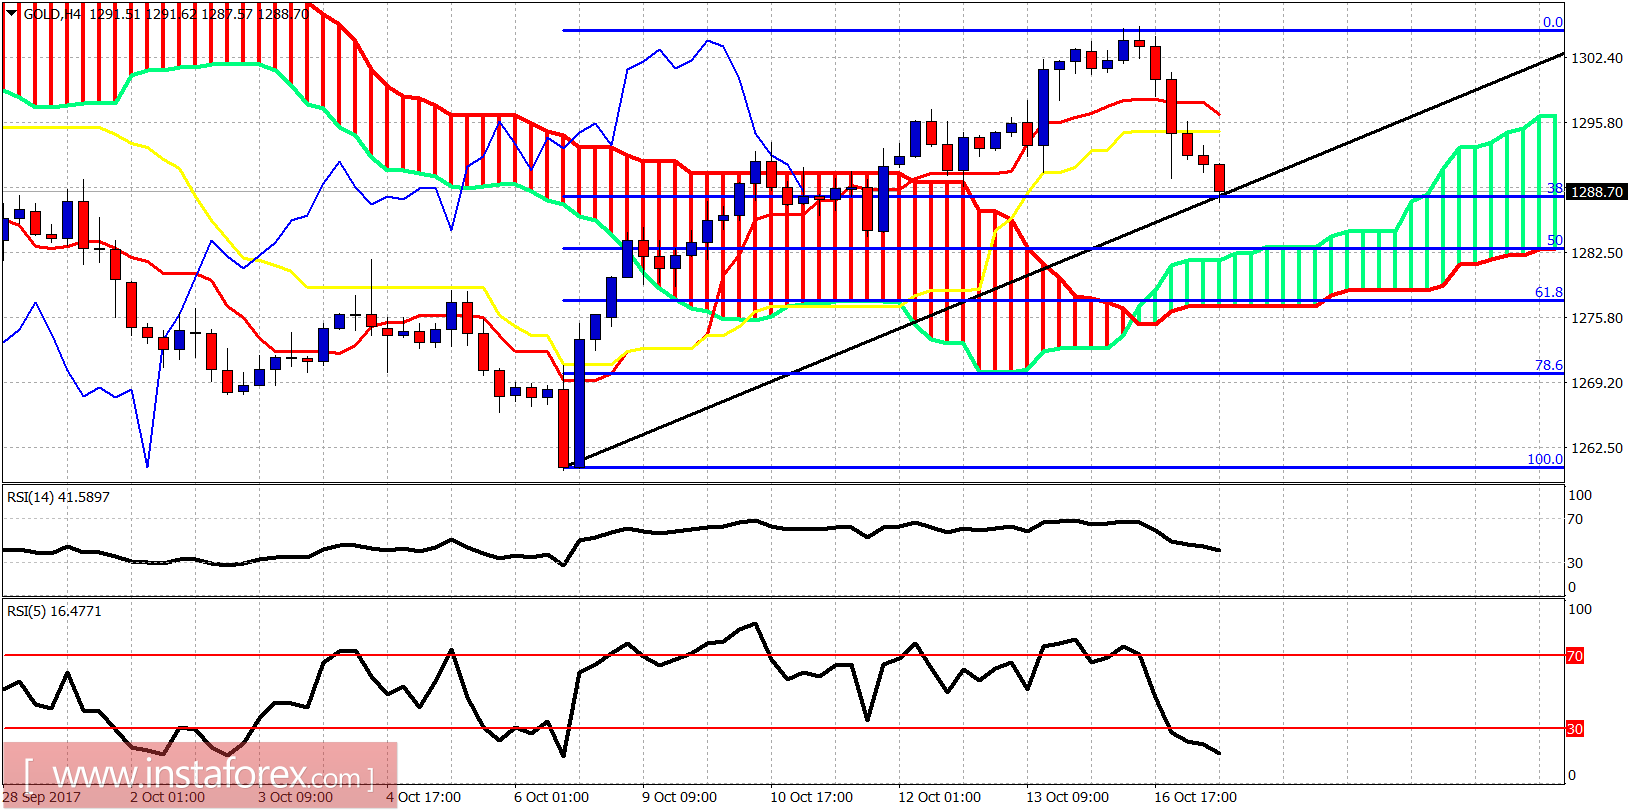
In Ichimoku cloud terms, this pullback is considered a buying opportunity. Price is above the 4-hour Kumo. Price is correcting the recent upward move from $1,260 to $1,306. Price has just reached the 38% Fibonacci retracement. Price could reach the Kumo and the 50% retracement before the up trend resumes.

Ichimoku indicator analysis of gold for October 17, 2017

On a weekly basis, we see a rejection at the tenkan-sen (Red line indicator). For the bullish scenario to remain valid, we need to see a long lower tail in this week's candle and eventually a break above the weekly tenkan-sen. A weekly close below the kijun-sen (yellow line indicator) will be a bearish sign.
Analyst InstaForex
Share this article:
parent
loader...
all-was_read__icon
You have watched all the best publications
presently.
We are already looking for something interesting for you...
all-was_read__star
Recently published:
loader...
More recent publications...