Main Quotes Calendar Forum
flag

FX.co ★ Ichimoku indicator analysis of USDX for October 17, 2017

parent
Forex Analysis:::2017-10-17T07:05:55

Ichimoku indicator analysis of USDX for October 17, 2017

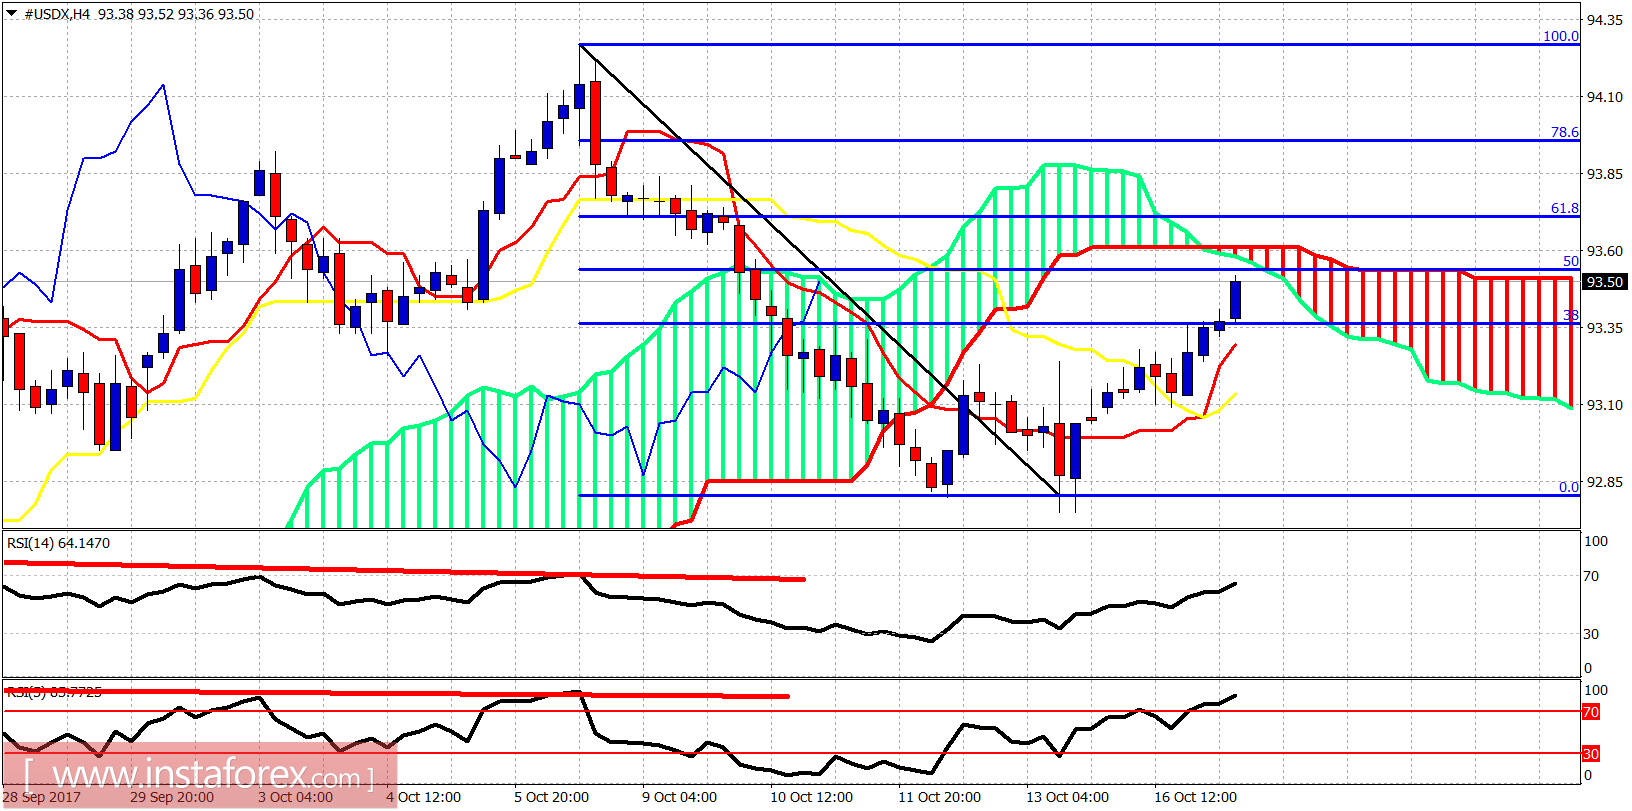
The Dollar index is finally bouncing as part of the correction of the downward move from the 94 area highs. Price has reached important short-term cloud and Fibo resistance.

Ichimoku indicator analysis of USDX for October 17, 2017

Price is trading below the Ichimoku cloud in the 4-hour chart. Support is at 93.10 and resistance is at 93.60. A rejection here will be a bearish sign. If price manages to break above the 61.8% Fibonacci retracement, then we could even see new monthly highs for the index.

Ichimoku indicator analysis of USDX for October 17, 2017

Blue lines - bullish channel

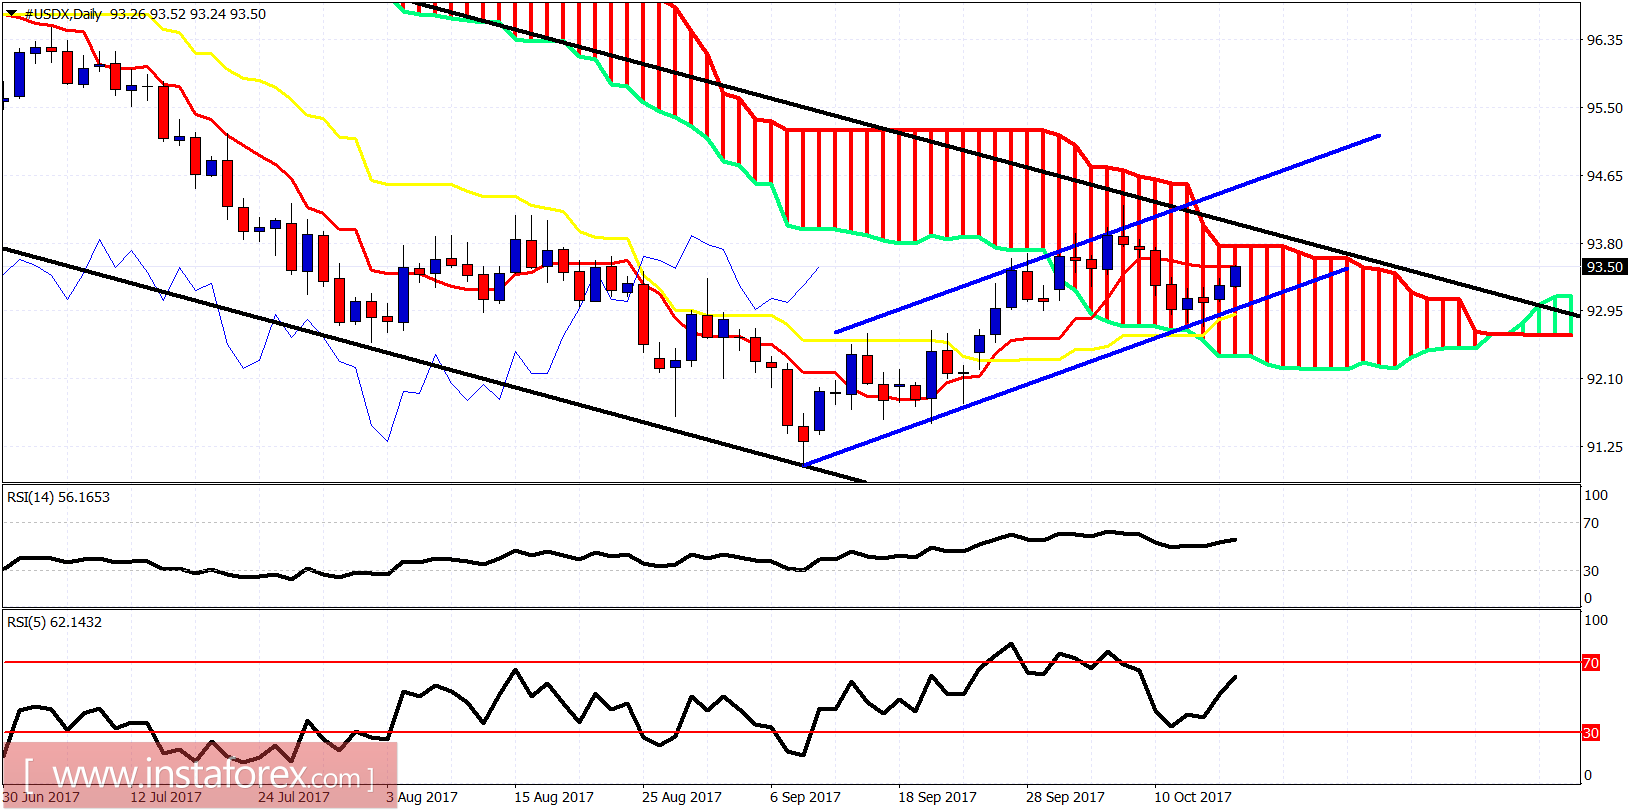
Black lines - bearish channel

Although price is still trapped inside the bearish daily channel, price in ichimoku terms on a daily basis has a neutral trend as price is trapped inside the Kumo (cloud). Channel support is at 93. Only a break below that level will confirm the resumption of the downward trend.

Analyst InstaForex
Share this article:
parent
loader...
all-was_read__icon
You have watched all the best publications
presently.
We are already looking for something interesting for you...
all-was_read__star
Recently published:
loader...
More recent publications...