


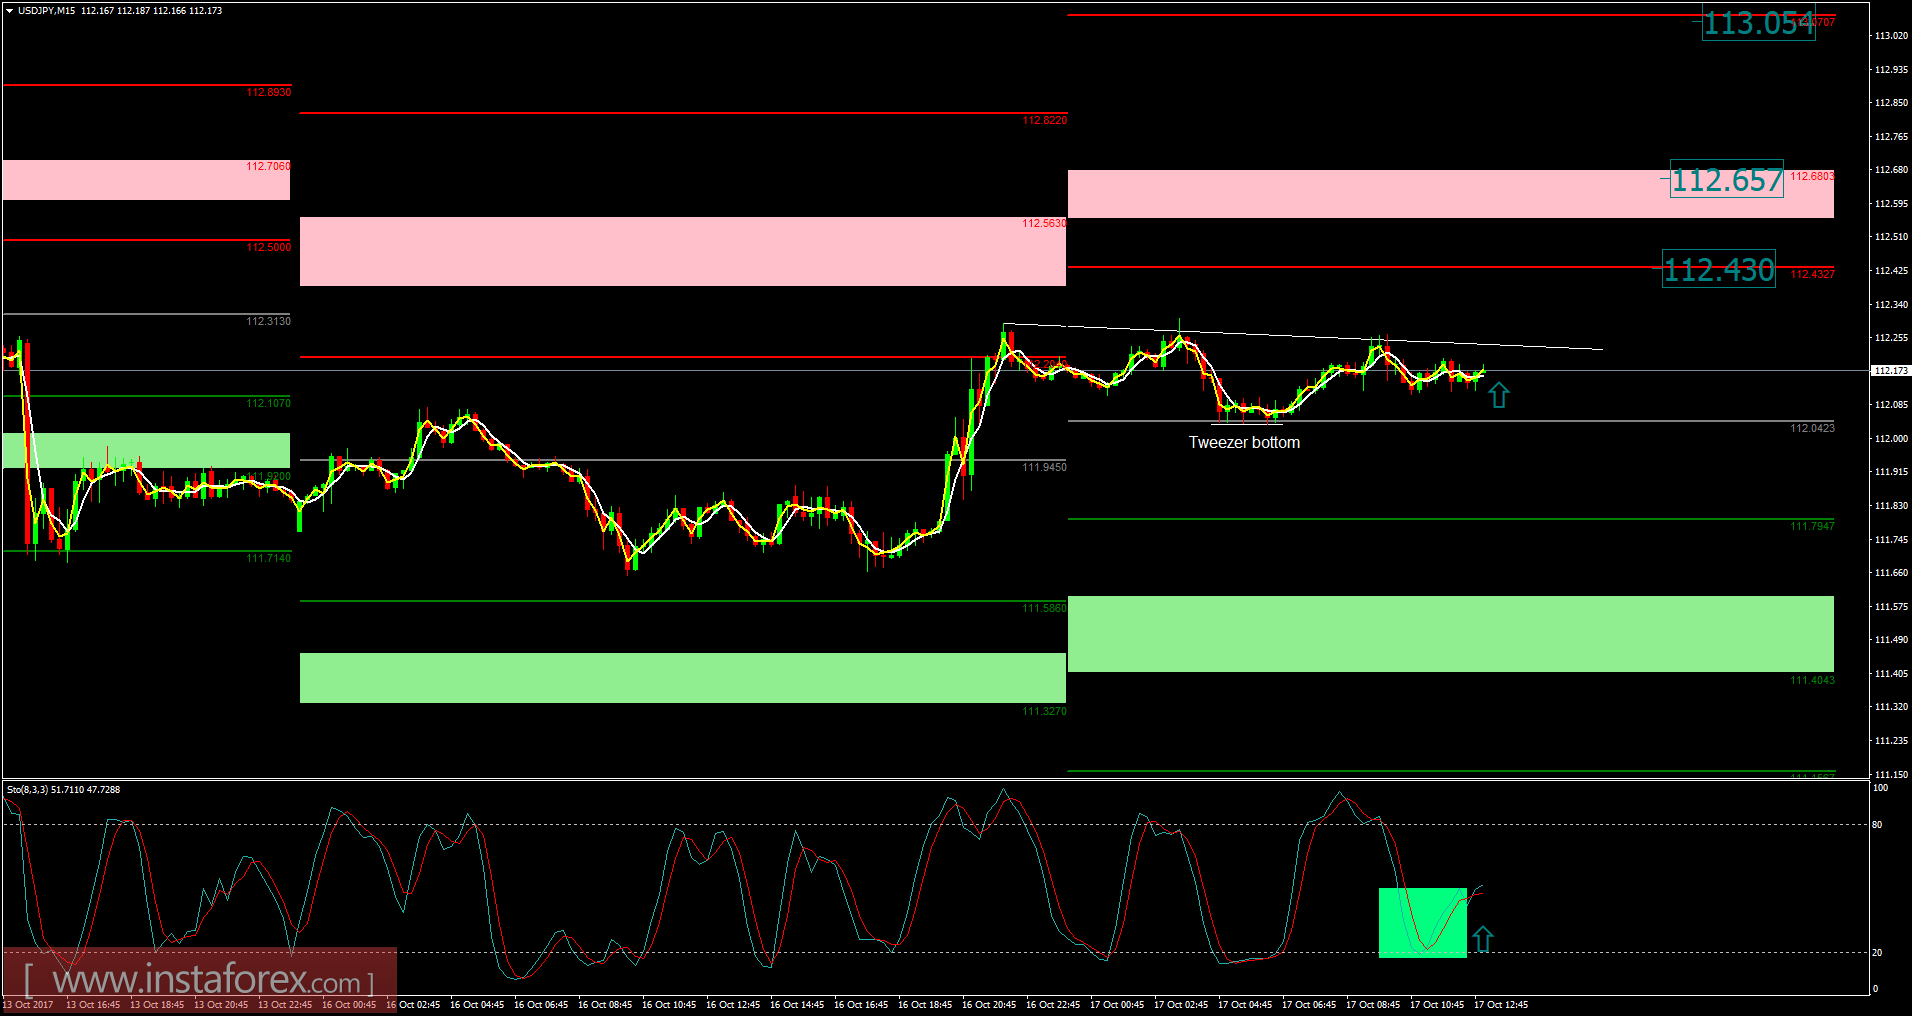
Recently, the USD/JPY pair has been trading sideways at the price of 112.17. According to the 15M time - frame, I found tweezer bottom from the pivot level at the price of 112.04, which is a sign that selling looks risky. The price is trading above the pivot, which is a sign that buyers are in control. Stochastic oscilator looks overbought and my advice is to watch for potential buying opportunities. The upward targets are set at the price of 112.43 (R1), 112.65 (R2), and 113.05 (R3).
Resistance levels:
R1: 112.43
R2: 112.65
R3: 113.05
Support levels:
S1: 111.80
S2: 111.40
S3: 111.15
Trading recommendations for today: watch for potential buying opportunities.


