


The index was under a buying interest across the board, pushing higher above the 200 SMA on the H1 chart. Currently, it is targeting the resistance level of 94.58, at which lies a key barrier for buyers. With a pullback below 93.35, we can expect a leg lower towards the psychological level of 93.00. The MACD indicator remains in the positive territory.
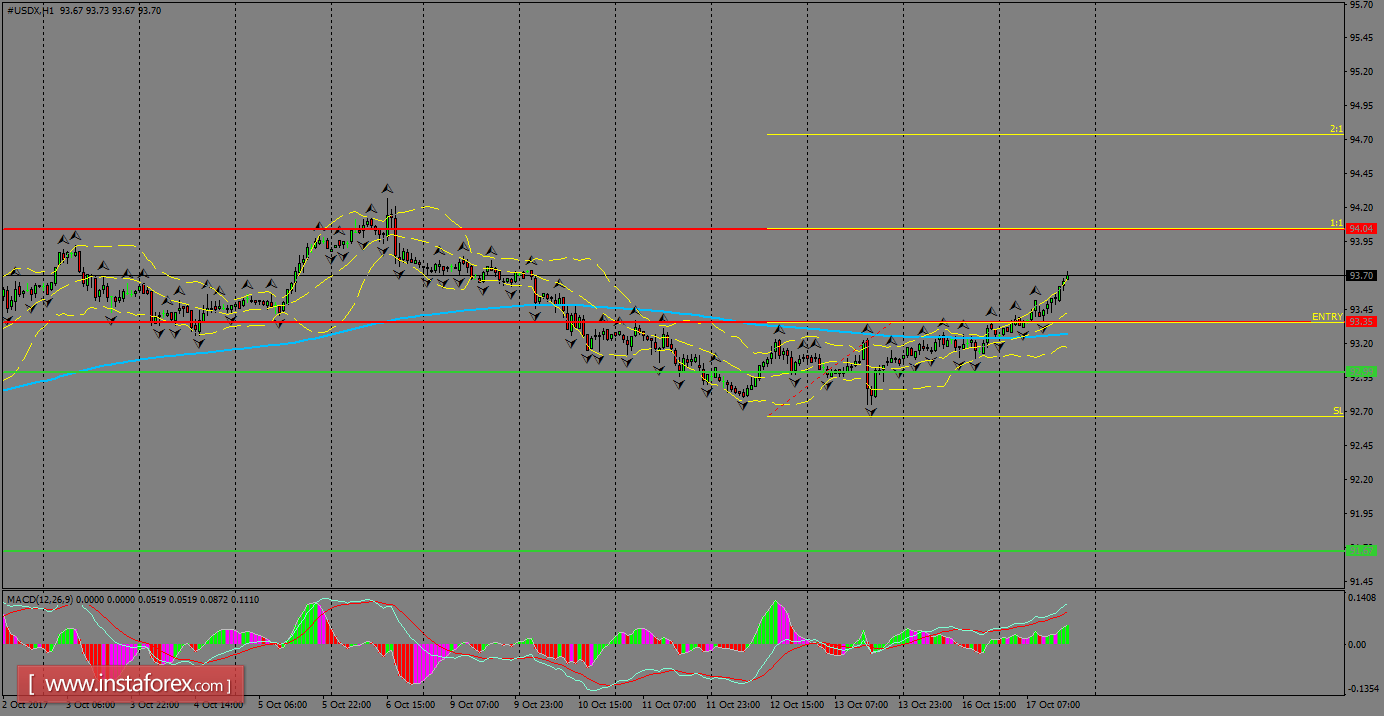
H1 chart's resistance levels: 93.35 / 94.58
H1 chart's support levels: 93.00 / 91.67
Trading recommendations for today: Based on the H1 chart, place buy (long) orders only if the USD Index breaks with a bullish candlestick; the resistance level is at 93.35, take profit is at 94.58 and stop loss is at 92.66.


