


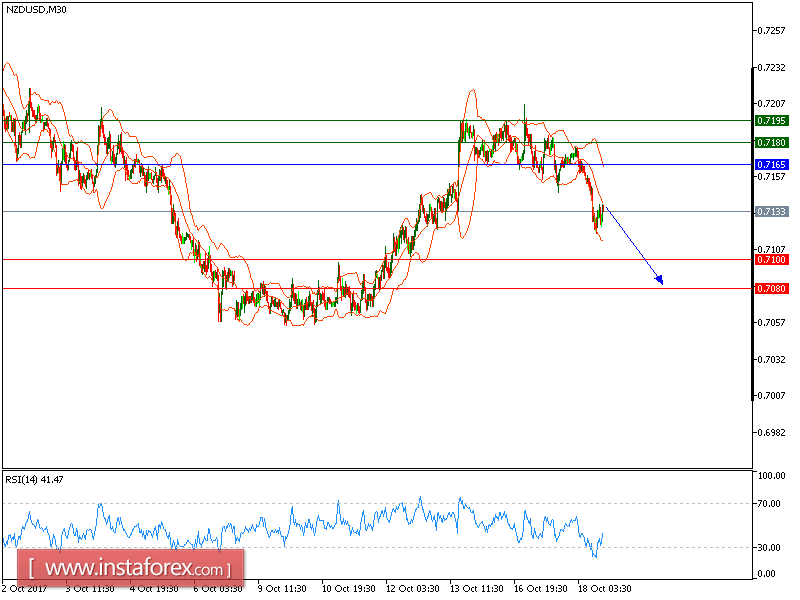
NZD/USD is expected to trade in a lower range as key resistance is set at 0.7165. The pair is trading below its key resistance at 0.7165, which should limit the upside potential. The relative strength index is mixed with a bearish bias. Even though a continuation of the technical rebound cannot be ruled out, its extent should be limited.
To sum up, as long as 0.7165 holds on the upside, a further decline to 0.7100 and even to 0.7080 seems more likely to occur.
The black line is showing the pivot point. Currently, the price is above the pivot point, which indicates long positions. If it remains below the pivot point, it will indicate short positions. The red lines are showing the support levels and the green line is indicating the resistance levels. These levels can be used to enter and exit trades.
Resistance levels: 0.7180, 0.7195, and 0.7220
Support levels: 0.7100, 0.7080, and 0.7050


