


As expected, the US dollar index reversed lower after being rejected at the 61.8% Fibonacci retracement resistance. The entire upward bounce should be in and a lower high is the bearish sign we were expecting.
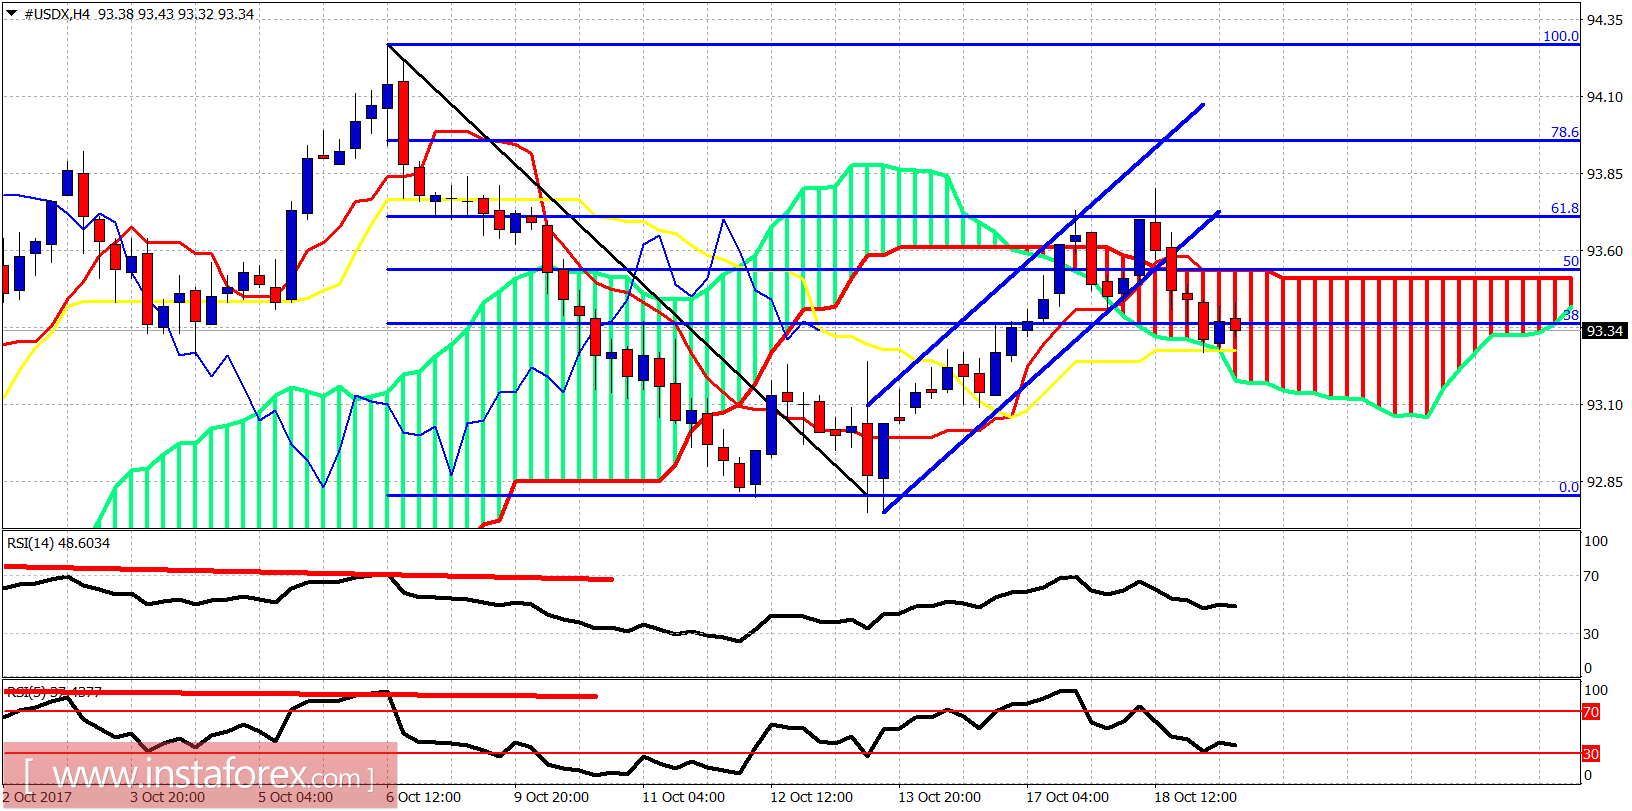
The Dollar index has broken out and below the bullish channel. This is the first bearish sign. Price got rejected at the 61.8% Fibonacci retracement and is trying to break below Kumo (cloud) support. This is the second bearish sign. The short-term support lies at 93.25. Resistance is at 93.50 and the next one at 93.71.
Blue lines - short-term bullish channel
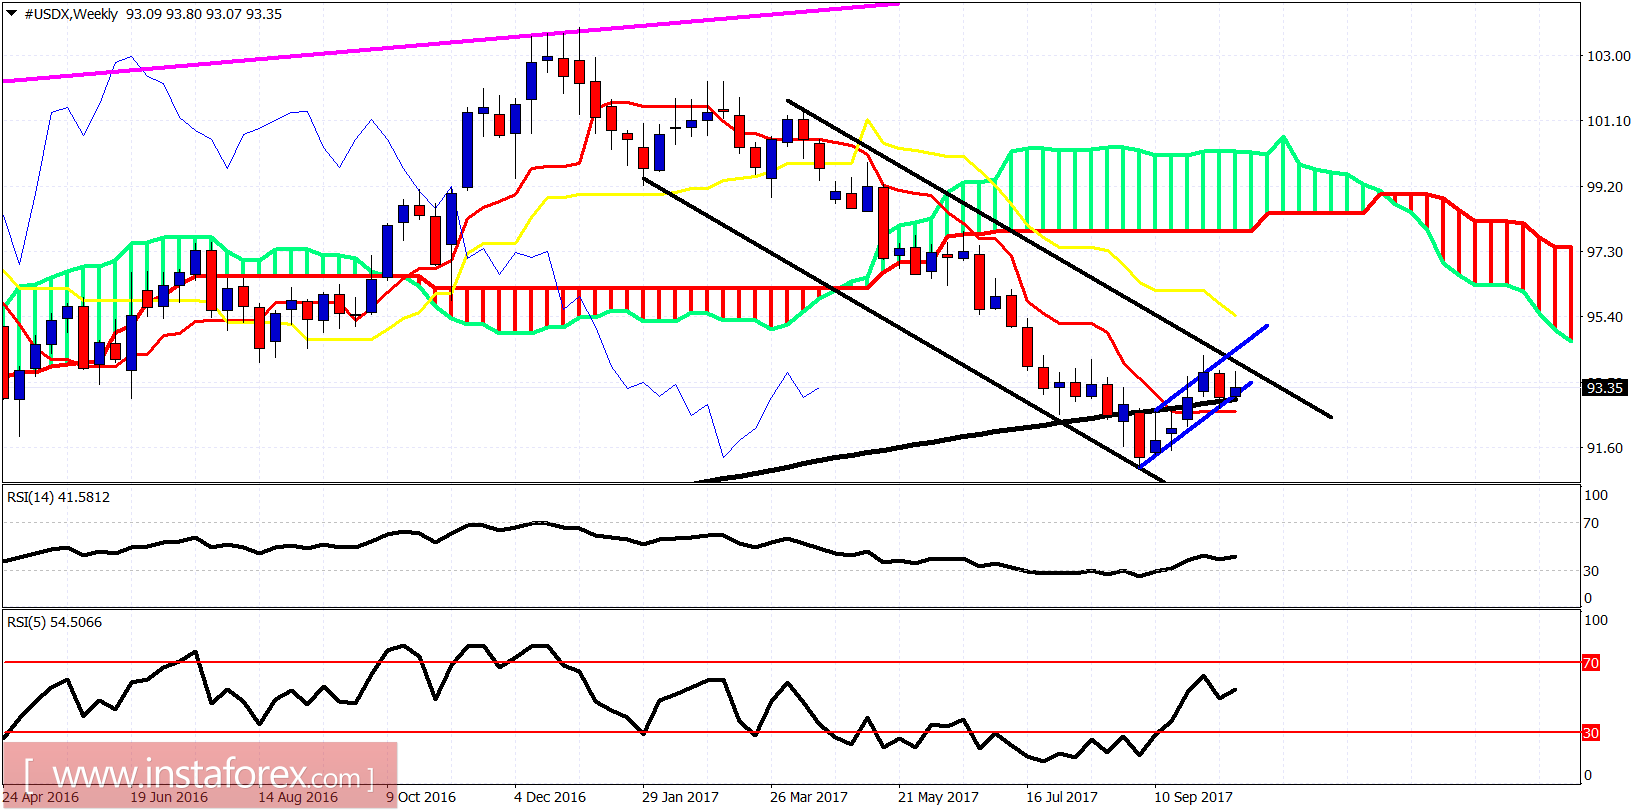
The dollar index remains in a medium-term bearish trend inside the bearish channel. Price got rejected a couple weeks back at the upper channel boundary. However, the price remains inside the short-term bullish channel. A break below 92.50 will confirm our bearish scenario that the next leg down towards 90 has started.


