


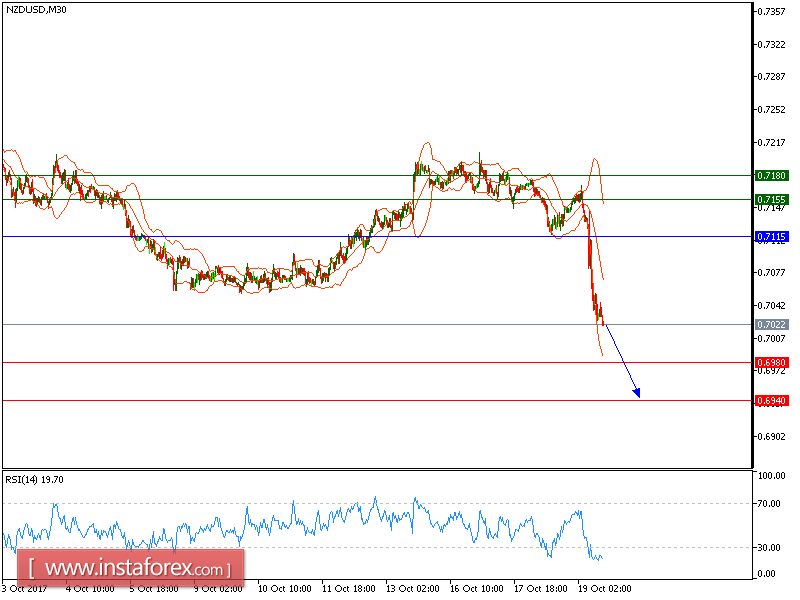
All our targets which we predicted in yesterday's analysis have been hit. NZD/USD is under pressure and expected to trade in lower range. The pair is likely to test the support at 0.6980 while being capped by the descending 20-period moving average. The intraday outlook is still very bearish as the 20-period moving average continues to stand below the 50-period one, and the relative strength index remains subdued below the neutrality level of 50. A break below 0.6980 would open a path toward 0.6940.
The black line is showing the pivot point. Currently, the price is above the pivot point, which indicates long positions. If it remains below the pivot point, it will indicate short positions. The red lines are showing the support levels and the green line is indicating the resistance levels. These levels can be used to enter and exit trades.
Resistance levels: 0.7155, 0.7170, and 0.7205
Support levels: 0.6980, 0.6940, and 0.6900


