


The index managed to retrace from October 18th highs and again it's consolidating the price action below the 200 SMA at H1 chart. The nearest support lies at the psychological level of 93.00. With a break below that area, October 13th lows might be tested, while a rebound at current stage could take USDX to touch the 94.04 level.
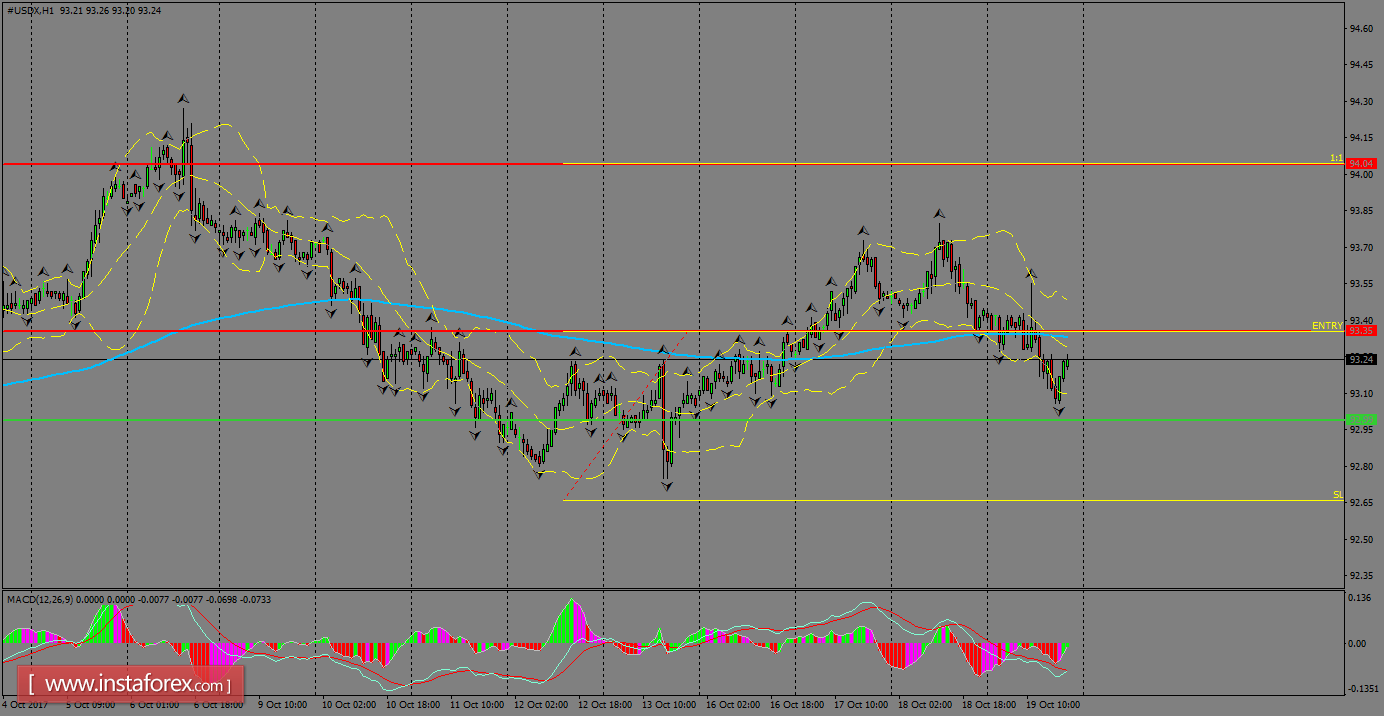
H1 chart's resistance levels: 93.35 / 94.58
H1 chart's support levels: 93.00 / 91.67
Trading recommendations for today: Based on the H1 chart, place buy (long) orders only if the USD Index breaks with a bullish candlestick; the resistance level is at 93.35, take profit is at 94.58 and stop loss is at 92.66.


