


The Dollar index reached the short-term 93 support level and bounces higher now. Price is in a short-term neutral trend as the index is mainly moving sideways between 94-93 levels.
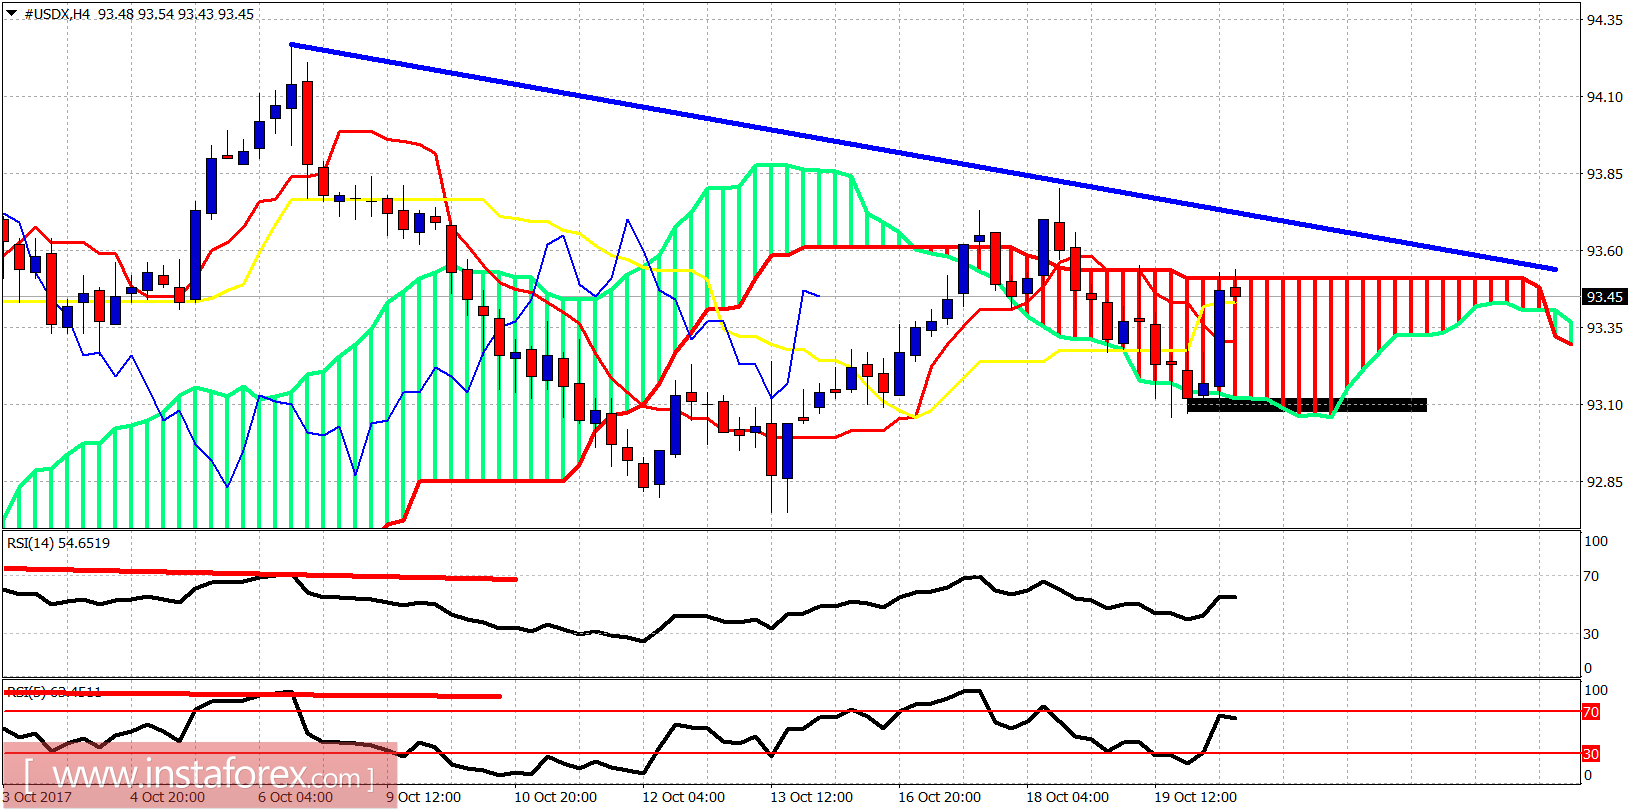
Rectangle - support
The Dollar index has reached the upper boundary of the 4-hour Kumo (cloud). 93.50 is the boundary resistance and the rise has stopped right there. Support is at the black rectangle. Breaking below it will open the way for a move towards 90 as price will be making lower lows and lower highs.
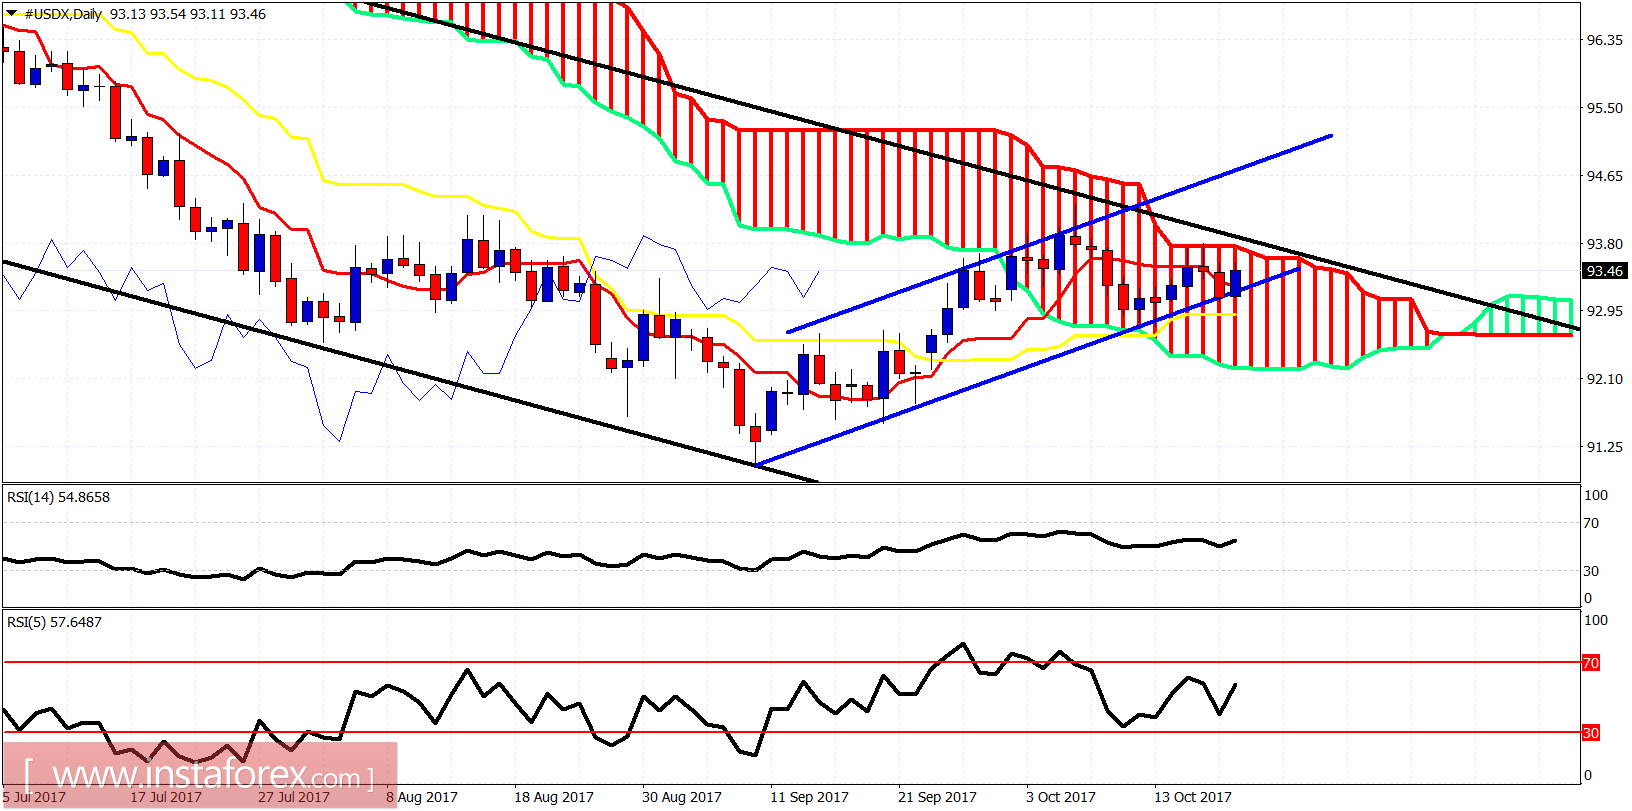
Blue lines - bullish channel
Yesterday, the Dollar index tested the lower channel boundary of the bullish channel. Support held and price bounced but it remains inside the cloud and below the upper boundary of the long-term bearish channel. Important resistance is at 93.90 and important support at 93.10. Whichever level breaks first, a strong move is expected to follow.


