


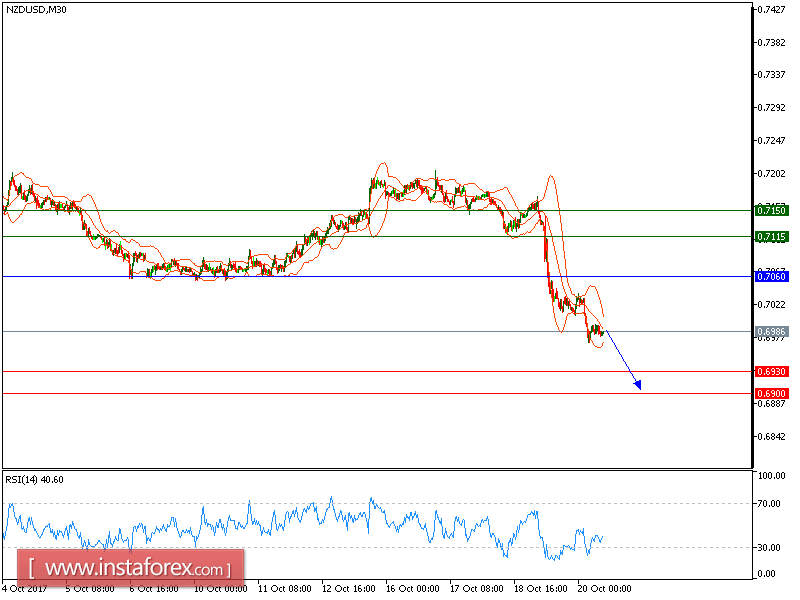
Our first target which we predicted in yesterday's analysis has been hit. NZD/USD is still uder pressure. The pair accelerated on the downside and is trading below its descending 50-period moving average. The relative strength index is below its neutrality level at 50.
To conclude, as long as 0.7060 holds on the upside, look for a return to 0.7060. A break below this level would trigger another drop to 0.6900.
The black line is showing the pivot point. Currently, the price is above the pivot point, which indicates long positions. If it remains below the pivot point, it will indicate short positions. The red lines are showing the support levels and the green line is indicating the resistance levels. These levels can be used to enter and exit trades.
Resistance levels: 0.7115, 0.7150, and 0.7175
Support levels: 0.6930, 0.6900, and 0.6865


