


The Dollar index has broken above the short-term trend line resistance and back above the 4 hour Ichimoku cloud. Short-term trend is bullish. The price has held above 93 on any attempt so far to break it so we can't ignore the bullish support the index has.
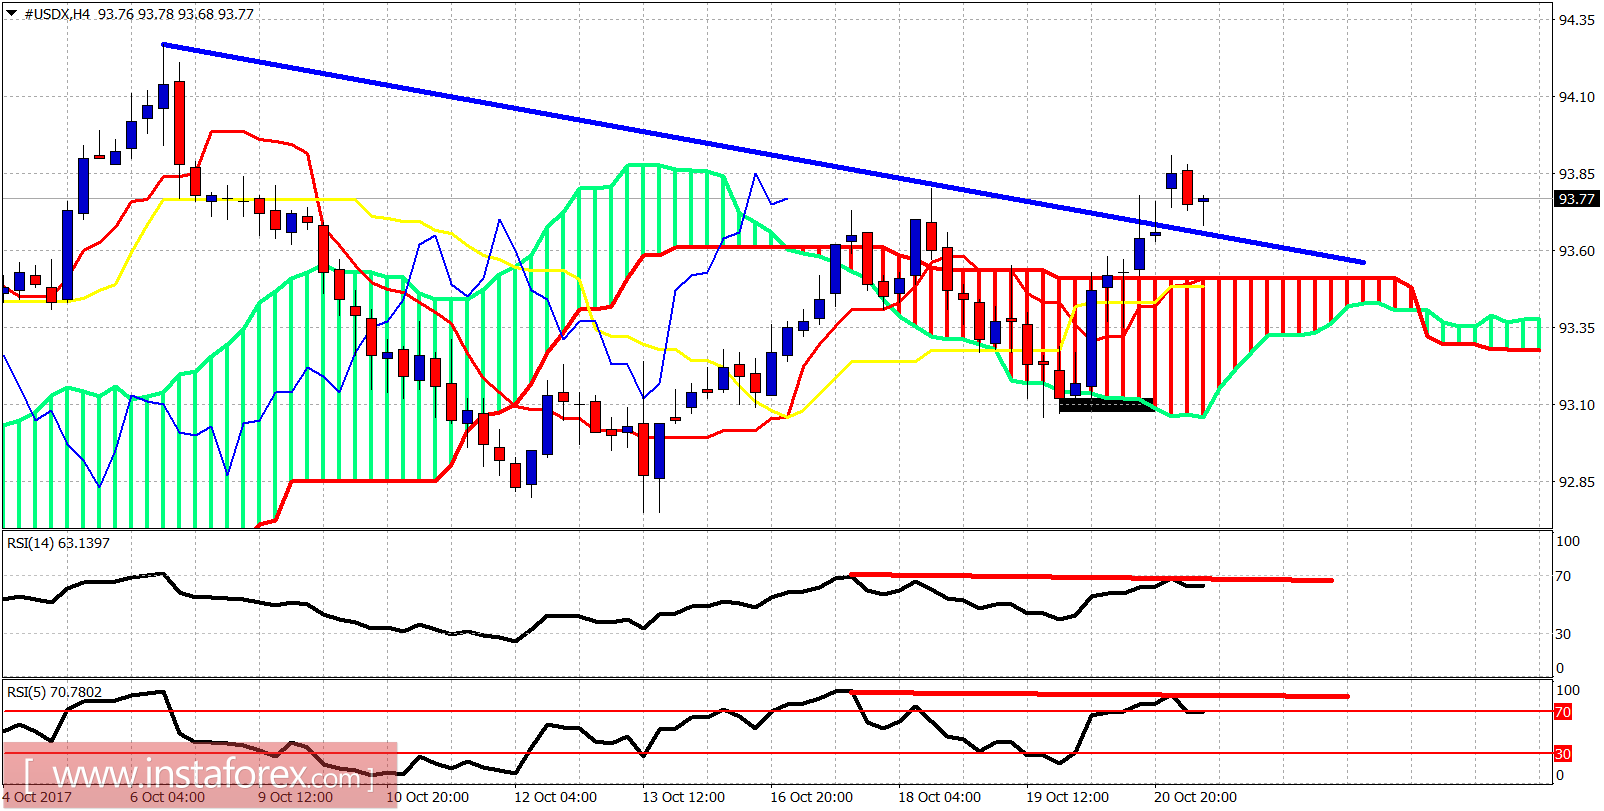
Blue line - trend line resistance (broken)
The Dollar index is making new higher highs. The price is above the 4 hour Kumo (cloud) and the blue trend line resistance. Support is at 93.50. Bears need to first break this level in order to show some sign of Dollar weakness. The most important level for bulls and bears is the 93 level. As long as we are above it, bulls remain in control.
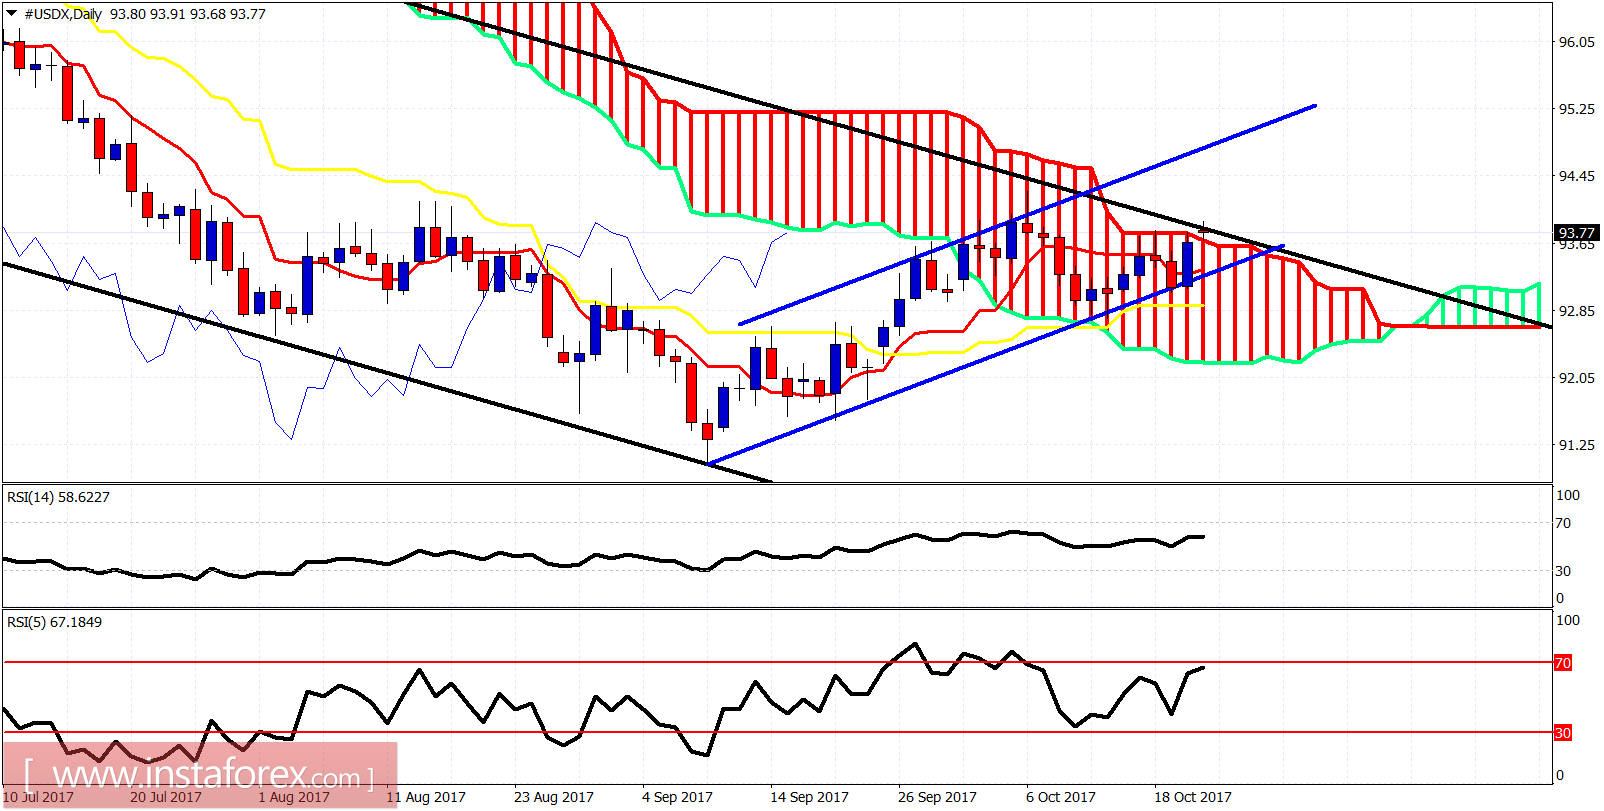
Black lines - bearish channel
The Dollar index remains inside the bullish channel and is trying to break above the bearish longer-term channel and the daily cloud resistance. Support is at 93.30. Resistance is at 94.


