Main Quotes Calendar Forum
flag

FX.co ★ Ichimoku indicator analysis of USDX for October 25, 2017

parent
Forex Analysis:::2017-10-25T07:15:52

Ichimoku indicator analysis of USDX for October 25, 2017

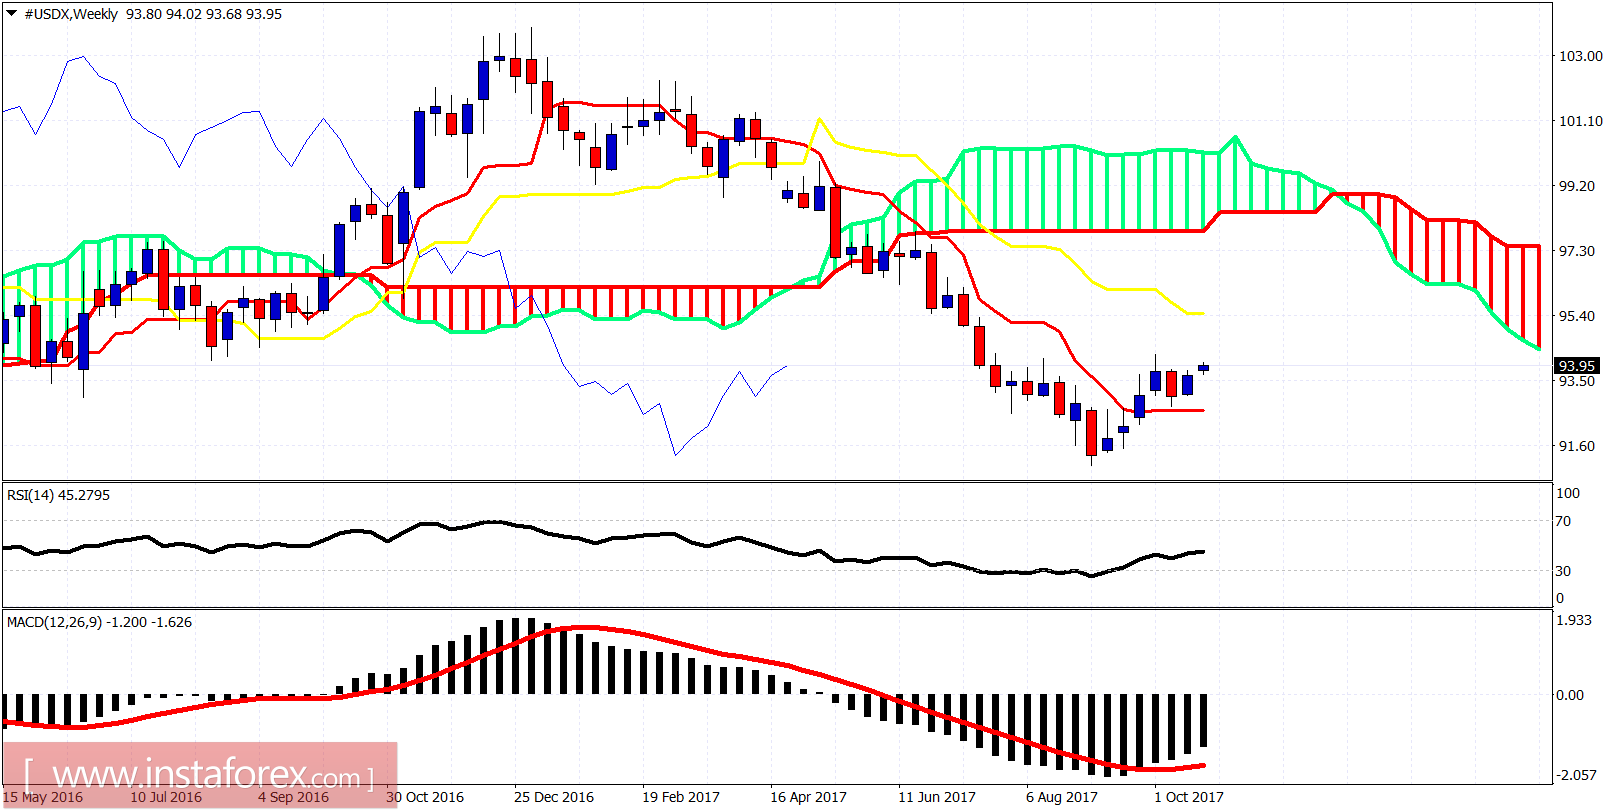
The Dollar index is back near its highs just below 94 but with RSI diverging, I believe we will not break convincingly above 94. I expect at least a short-term pull back towards 93.50 at least. The trend remains bullish.

Ichimoku indicator analysis of USDX for October 25, 2017

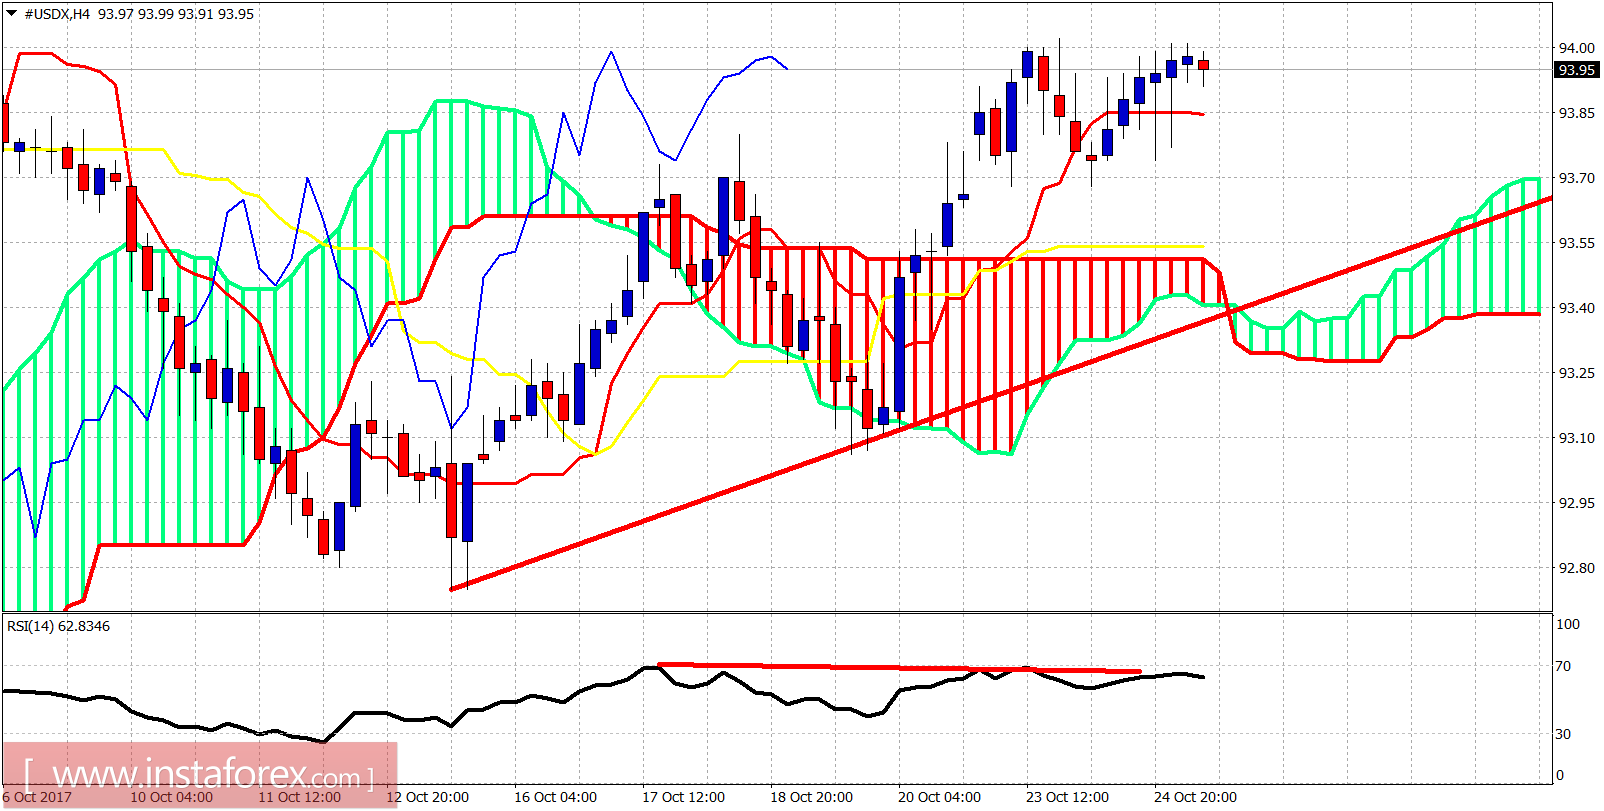
Red trend line -support

The Dollar index is making higher highs and higher lows. Short-term trend is bullish as the price is above the Kumo (cloud) in the 4-hour chart. Support is at 93.55 and next at 93.40. Resistance is at 94.

Ichimoku indicator analysis of USDX for October 25, 2017

On a weekly basis, the trend is bearish. Price is making a bigger than usual bounce and has broken above the tenkan-sen (red line indicator). As long as the price is above 92.60 we could see a move towards 95.40 where the kijun-sen is found. Breaking below 92.60 will open the way for a push to new lows below 91 or even 90.
Analyst InstaForex
Share this article:
parent
loader...
all-was_read__icon
You have watched all the best publications
presently.
We are already looking for something interesting for you...
all-was_read__star
Recently published:
loader...
More recent publications...