


Gold price has broken to new lows. In our last analysis we said that a new rejection at $1,282-83 would be a bearish signal and that a new low would not be avoided. Trend remains bearish. Although the Wedge pattern was broken upwards, price was not strong enough to break above the short-term resistance.
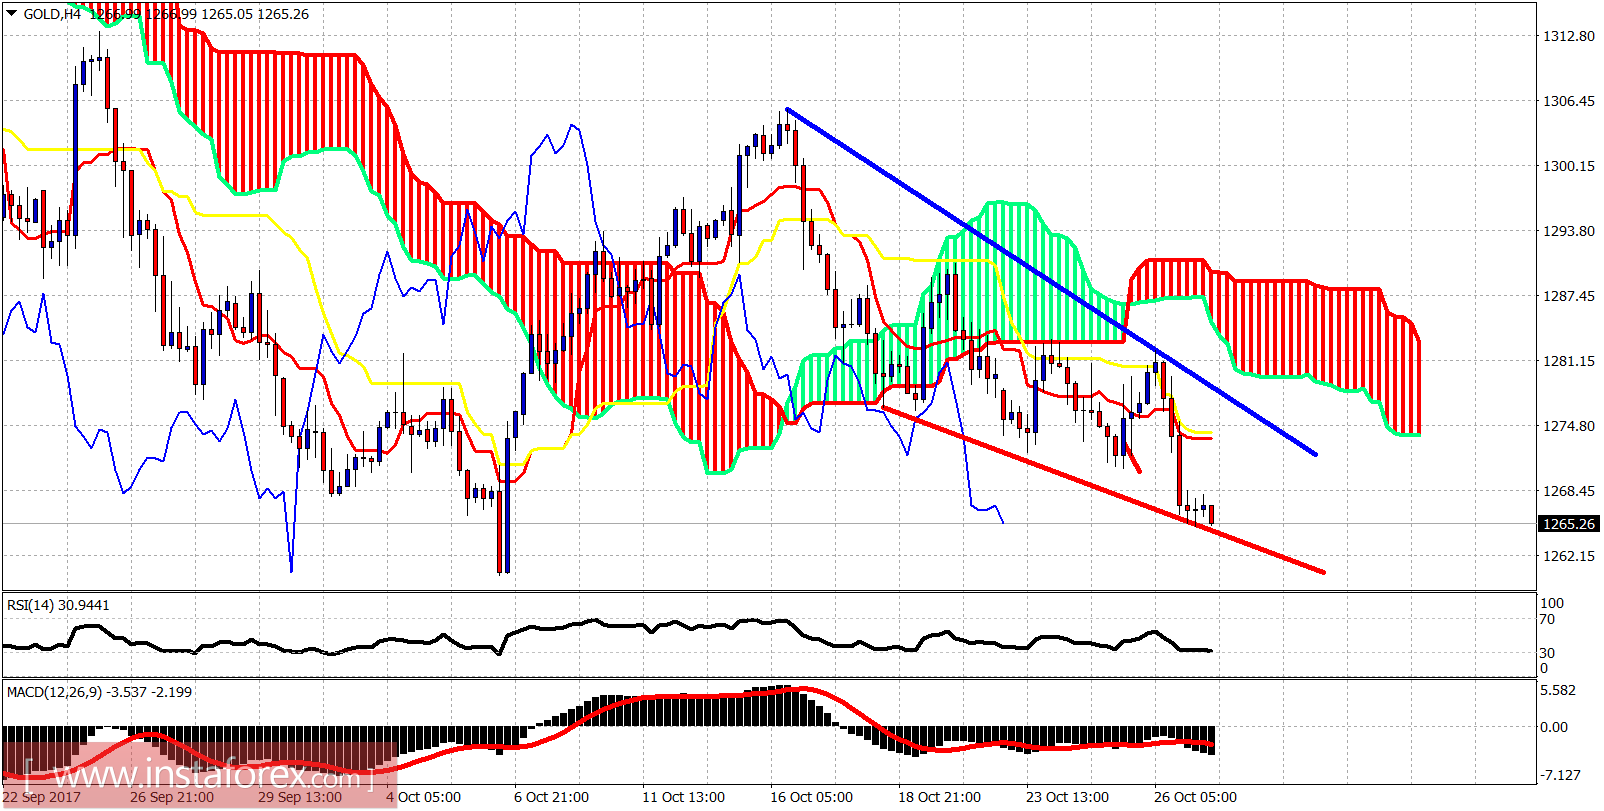
Red line - support
Gold price is making lower lows and lower highs. Price got rejected at the kijun-sen (yellow line indicator). The trend remains bearish as long as the price is below $1,283. The new low has increased the importance of the $1,283 resistance.
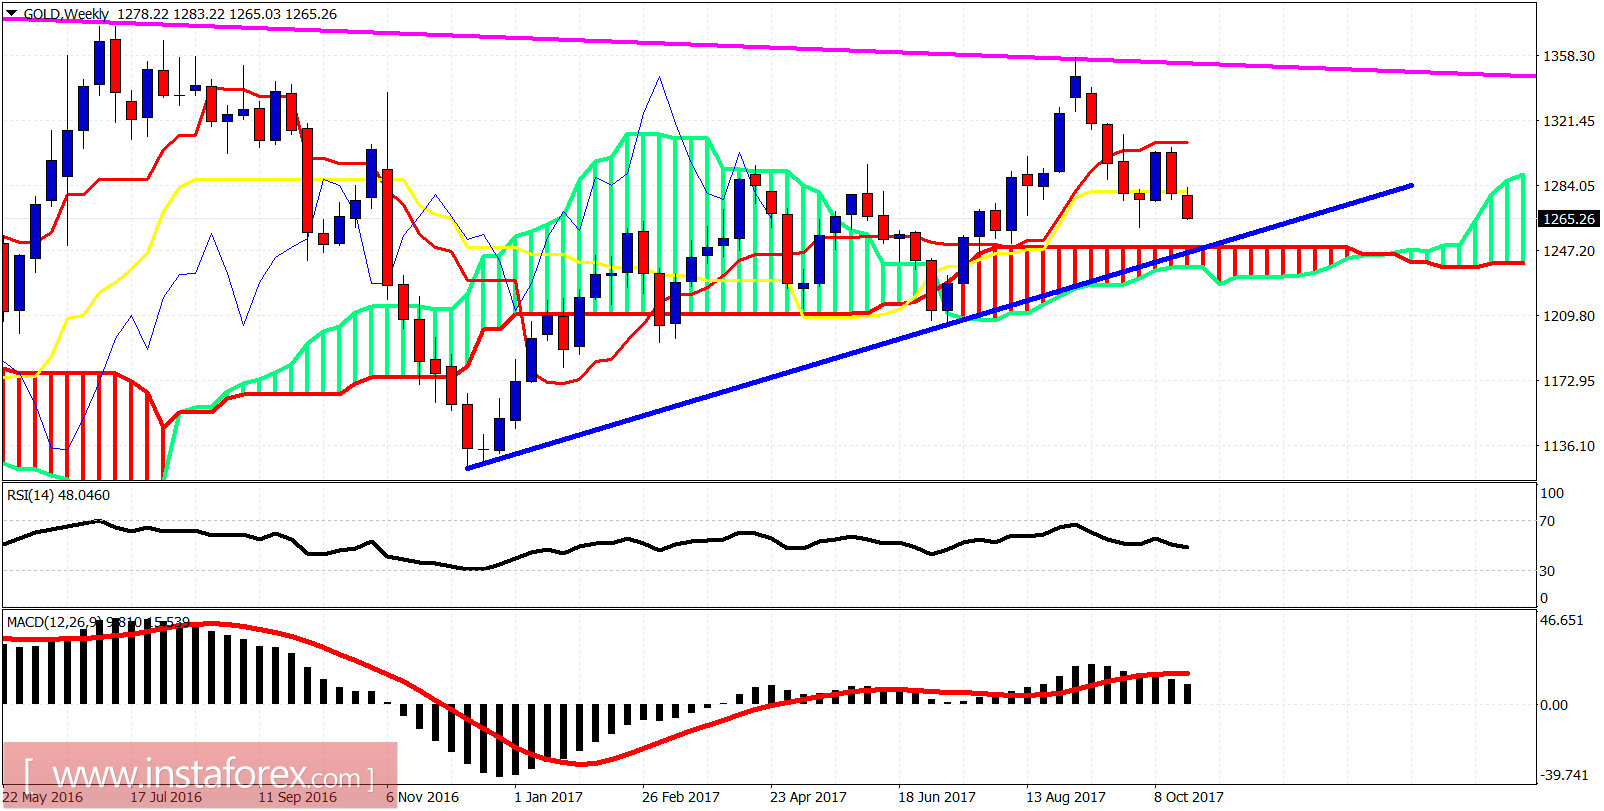
Magenta line - long-term resistance
Gold price remains below the weekly kijun-sen (yellow line indicator). Trend remains bullish and we still consider this as a pullback in a larger up trend. Price is heading towards the blue trend line and the weekly Kumo (cloud) support. This is the last line of defense for bulls.


