Main Quotes Calendar Forum
flag

FX.co ★ Ichimoku indicator analysis of gold for October 31, 2017

parent
Forex Analysis:::2017-10-31T07:49:01

Ichimoku indicator analysis of gold for October 31, 2017

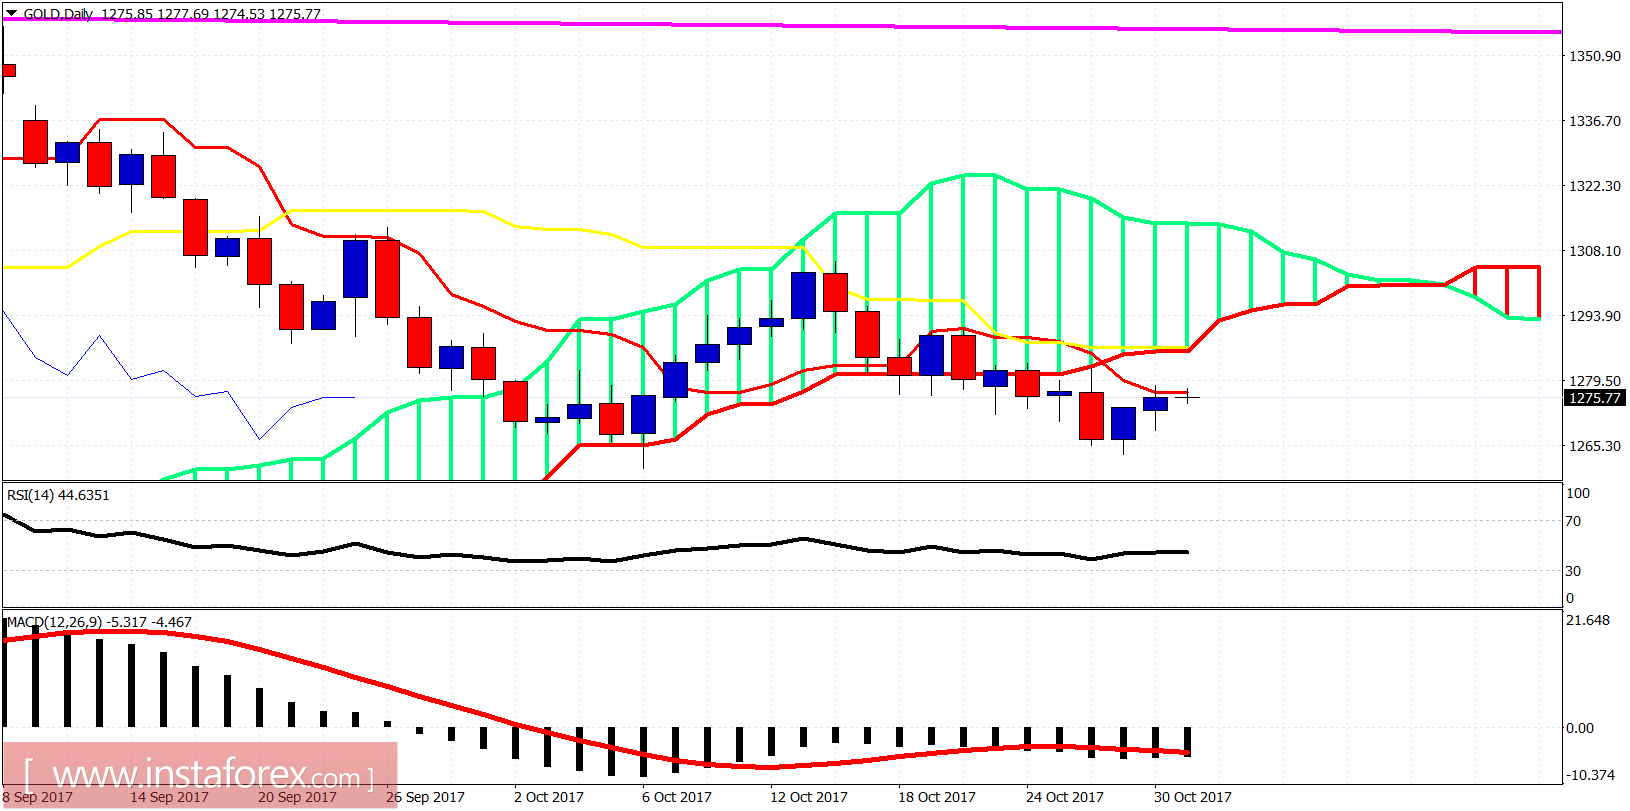
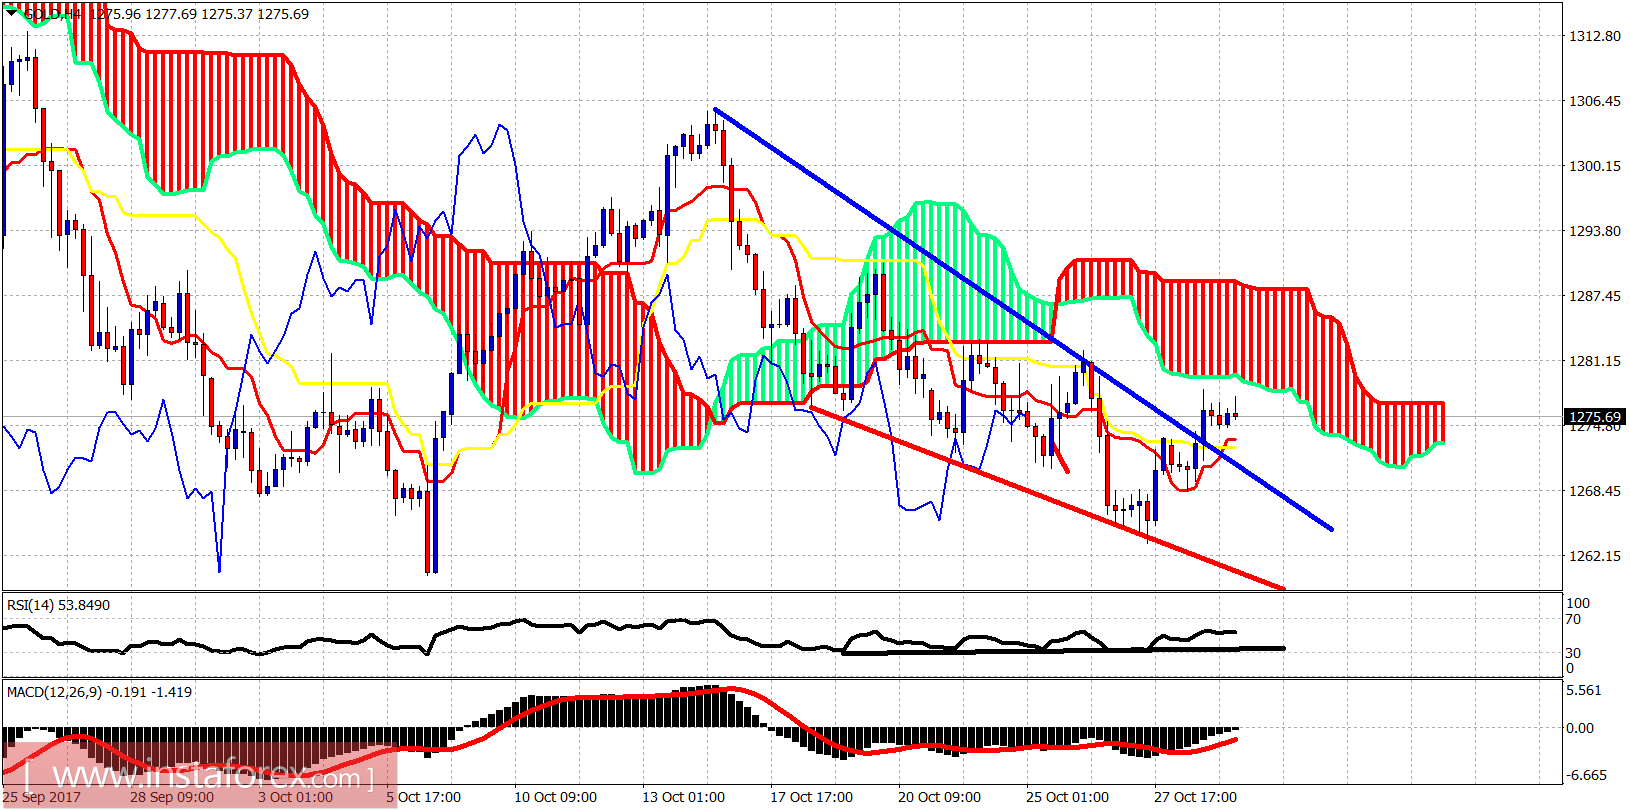
Gold price made a higher high in the very short term yesterday, breaking above and out of the downward sloping wedge, but price remains below the 4 hour Cloud resistance. The trend remains bearish.

Ichimoku indicator analysis of gold for October 31, 2017

Blue line - resistance

Red line - support

Gold price is trading above both the tenkan- and kijun-sen indicators in the 4 hour chart but below the Kumo (cloud) resistance. Bulls need not only to break out of the Wedge but also penetrate the cloud resistance at $1,280-$1,287. Breaking above the cloud would be a bullish breakout confirmation. Until then we are still in danger of visiting lower levels.

Ichimoku indicator analysis of gold for October 31, 2017

On a daily basis gold price is trying to recapture the tenkan-sen indicator (red line). Important cloud resistance is at $1,286. A daily close above it will be a bullish sign. Support lies at $1,268. If it is broken, we should expect the price to move lower towards $1,255-60.
Analyst InstaForex
Share this article:
parent
loader...
all-was_read__icon
You have watched all the best publications
presently.
We are already looking for something interesting for you...
all-was_read__star
Recently published:
loader...
More recent publications...